 6
6peptides
spectra
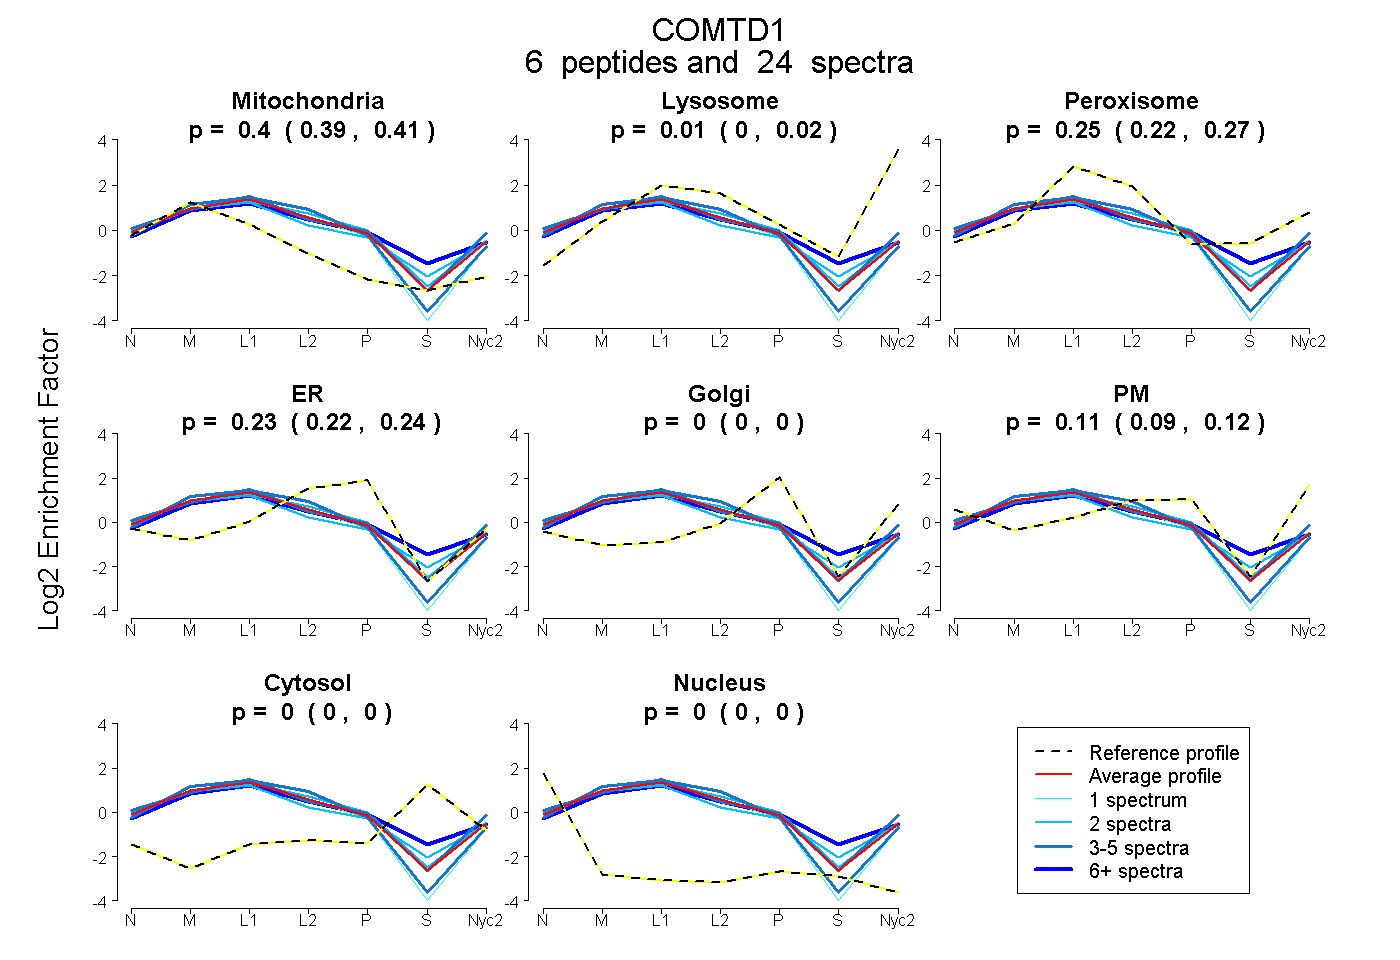
0.393 | 0.411
0.000 | 0.024
0.219 | 0.271
0.216 | 0.244
0.000 | 0.000
0.090 | 0.120
0.000 | 0.000
0.000 | 0.000
3peptides
spectra

0.686 | 0.753
0.189 | 0.250
0.021 | 0.080
0.000 | 0.000
0.000 | 0.000
0.000 | 0.000
0.000 | 0.000
10peptides
spectra
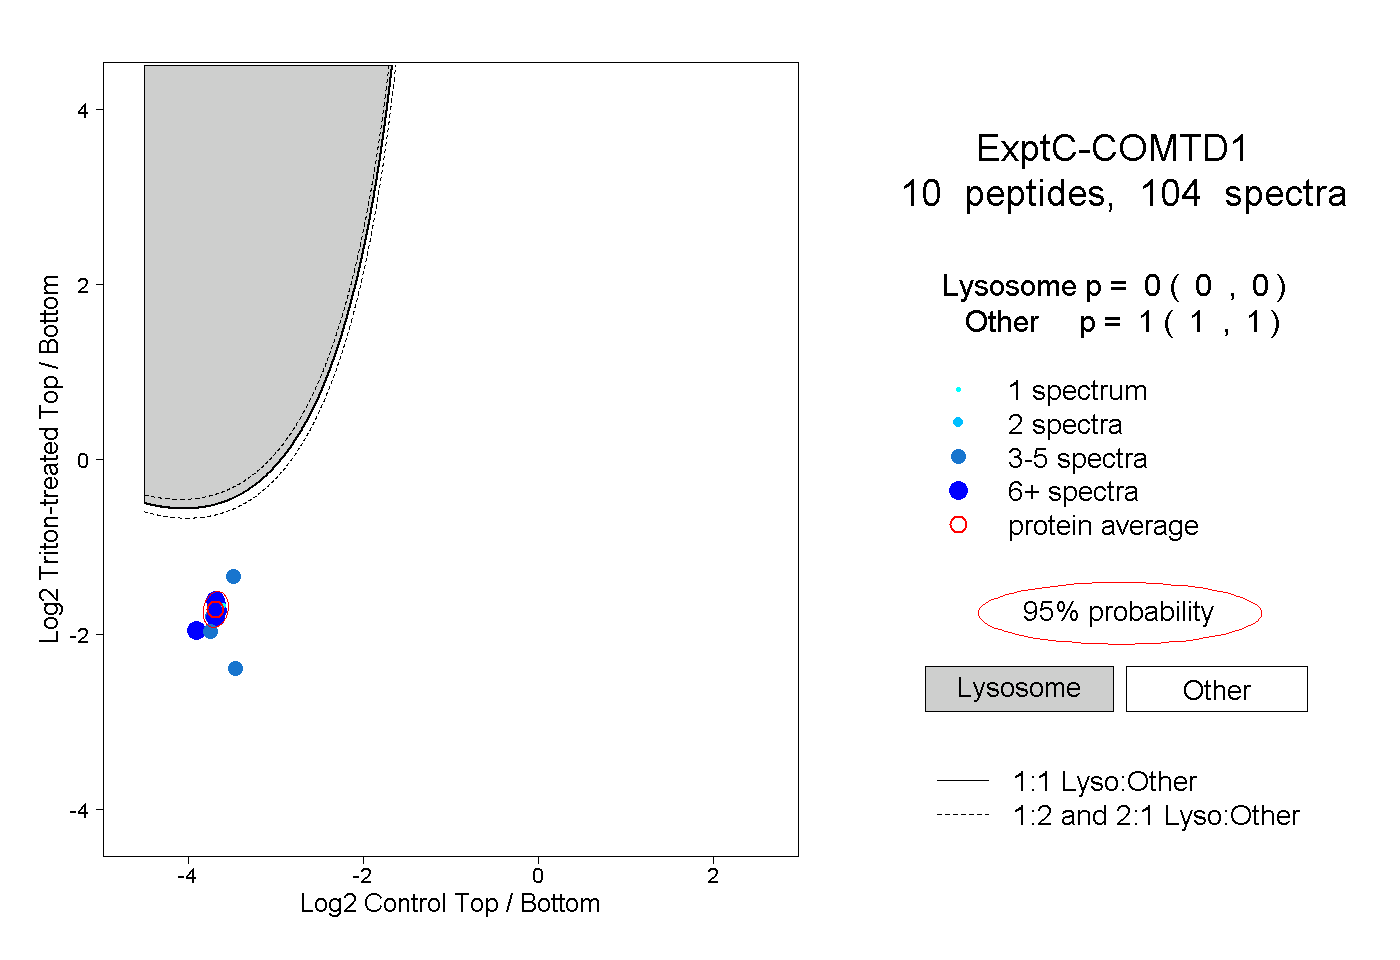
0.000 | 0.000
1.000 | 1.000
4peptides
spectra
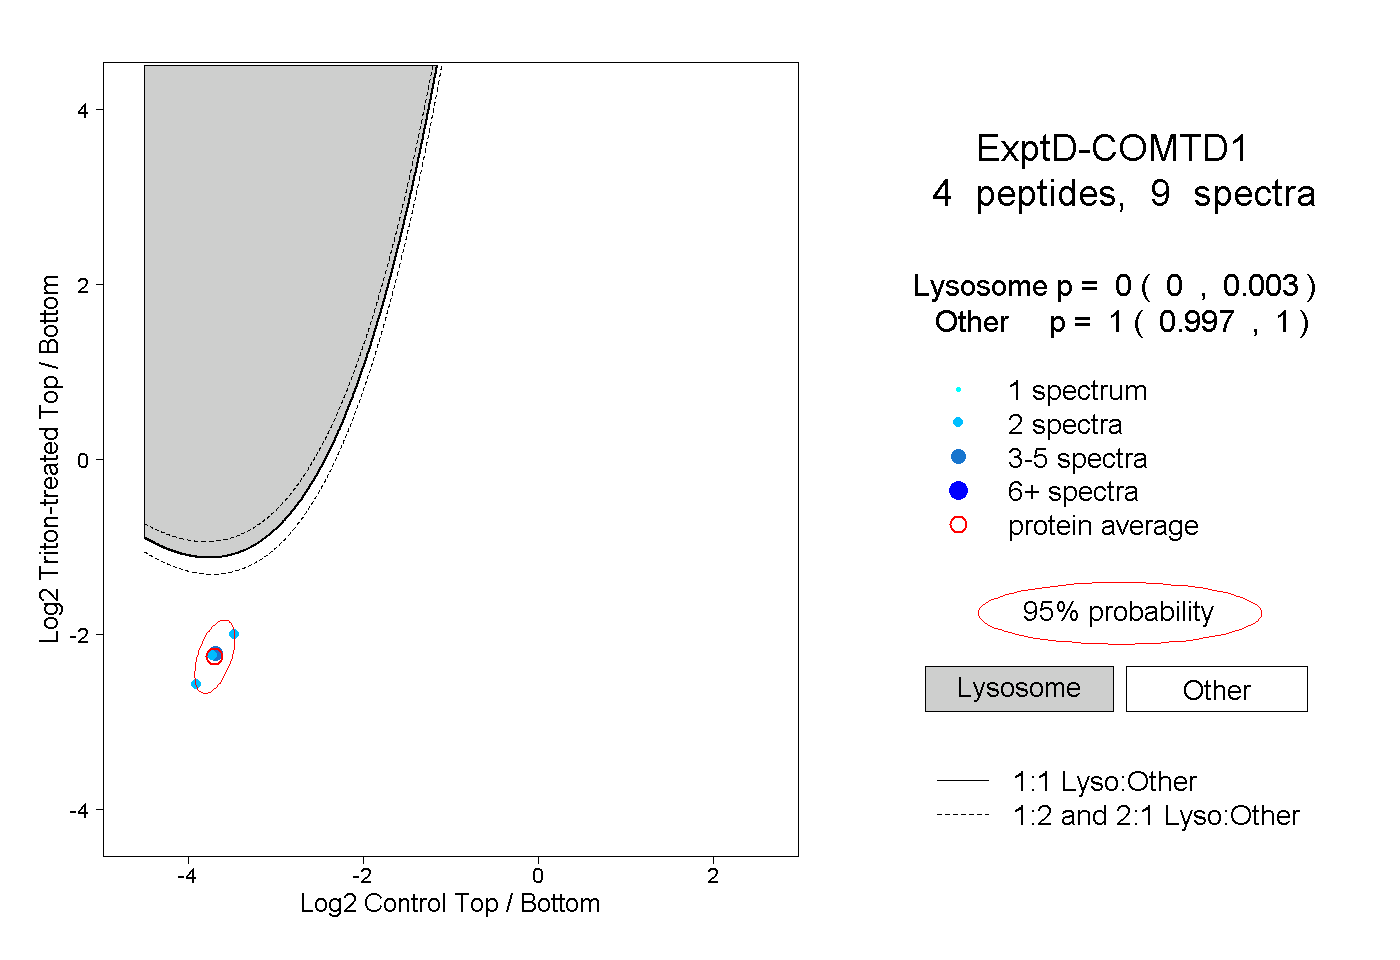
0.000 | 0.003
0.997 | 1.000