 6
6peptides
spectra
0.393 | 0.411
0.000 | 0.024
0.219 | 0.271
0.216 | 0.244
0.000 | 0.000
0.090 | 0.120
0.000 | 0.000
0.000 | 0.000
| Plot | Mito | Lyso | Perox | ER | Golgi | PM | Cytosol | Nucleus | |||||
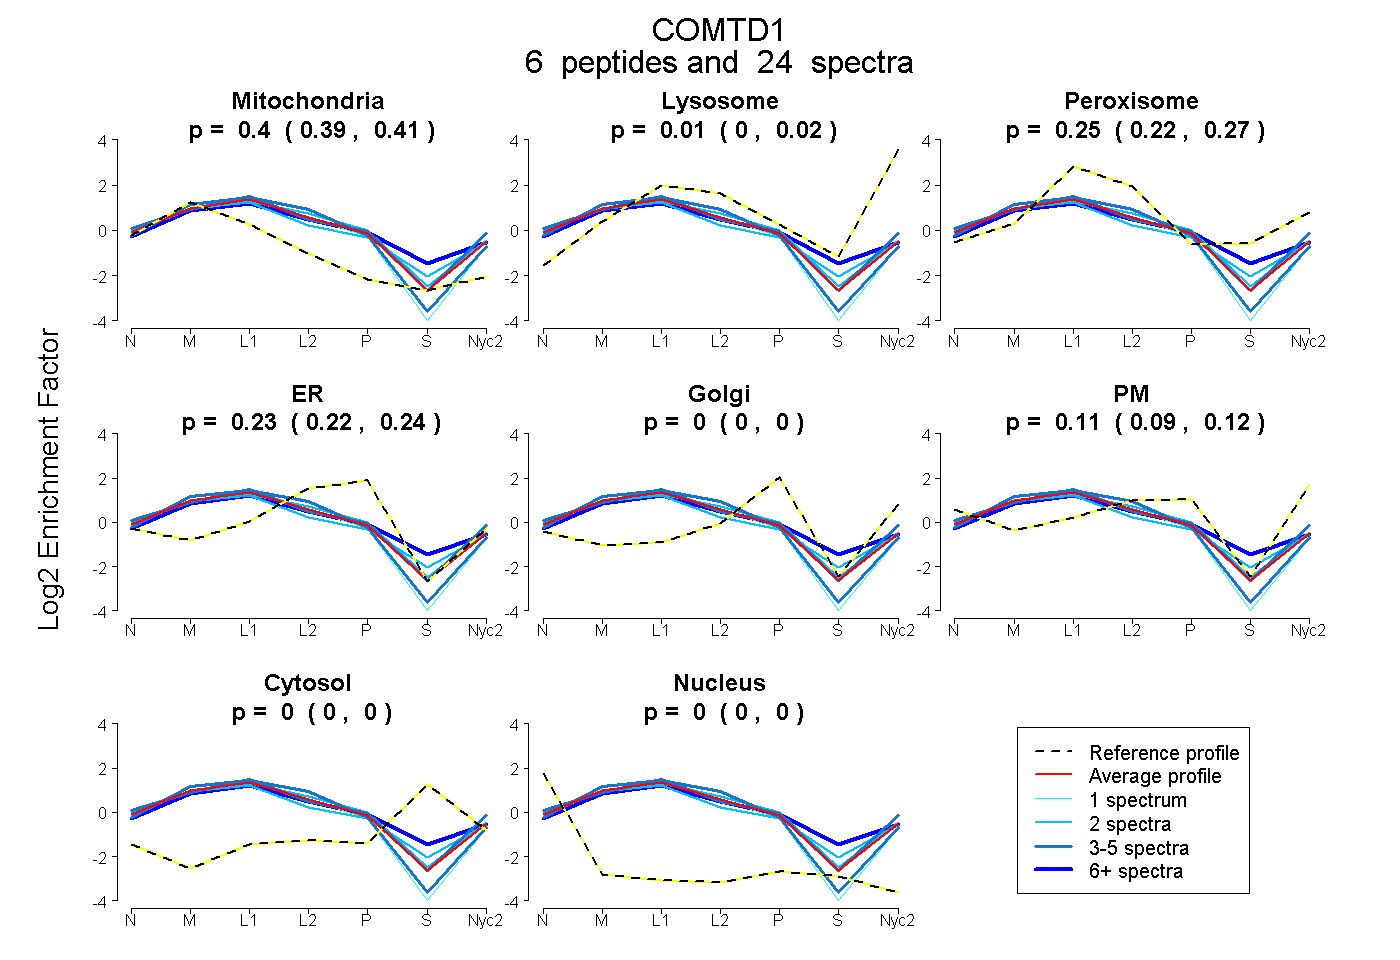
| Expt A |
6 peptides |
24 spectra |
|
0.403 0.393 | 0.411 |
0.011 0.000 | 0.024 |
0.248 0.219 | 0.271 |
0.232 0.216 | 0.244 |
0.000 0.000 | 0.000 |
0.106 0.090 | 0.120 |
0.000 0.000 | 0.000 |
0.000 0.000 | 0.000 |
| 5 spectra, WPPWGYR | 0.360 | 0.000 | 0.259 | 0.113 | 0.000 | 0.268 | 0.000 | 0.000 | ||
| 1 spectrum, GEVLQPQPK | 0.514 | 0.077 | 0.043 | 0.314 | 0.000 | 0.052 | 0.000 | 0.000 | ||
| 2 spectra, ENCTAYYER | 0.442 | 0.000 | 0.277 | 0.127 | 0.000 | 0.154 | 0.000 | 0.000 | ||
| 5 spectra, LGRPLWK | 0.449 | 0.057 | 0.149 | 0.346 | 0.000 | 0.000 | 0.000 | 0.000 | ||
| 2 spectra, EHPALR | 0.359 | 0.000 | 0.272 | 0.259 | 0.000 | 0.110 | 0.000 | 0.000 | ||
| 9 spectra, AVECVR | 0.352 | 0.000 | 0.405 | 0.155 | 0.089 | 0.000 | 0.000 | 0.000 |
| Plot | Mito | Lyso or Perox | ER | Golgi | PM | Cytosol | Nucleus | ||||||
| Expt B |
3 peptides |
10 spectra |
 |
0.724 0.686 | 0.753 |
0.222 0.189 | 0.250 |
0.053 0.021 | 0.080 |
0.000 0.000 | 0.000 |
0.000 0.000 | 0.000 |
0.000 0.000 | 0.000 |
0.000 0.000 | 0.000 |
|||
| Plot | Lyso | Other | |||||||||||
| Expt C |
10 peptides |
104 spectra |
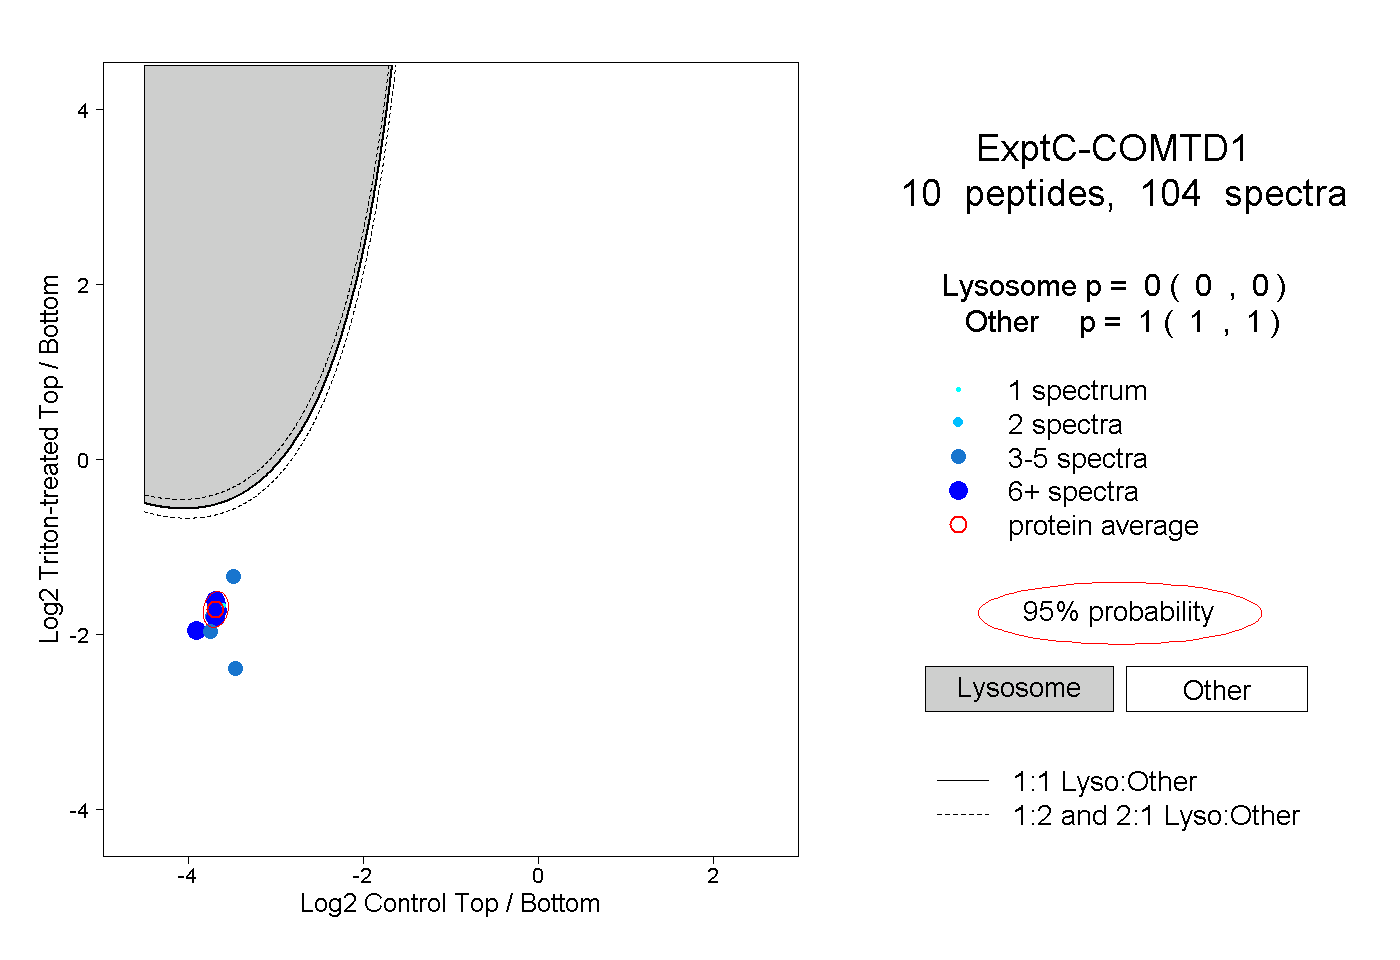 |
0.000 0.000 | 0.000 |
1.000 1.000 | 1.000 |
||||||||
| Plot | Lyso | Other | |||||||||||
| Expt D |
4 peptides |
9 spectra |
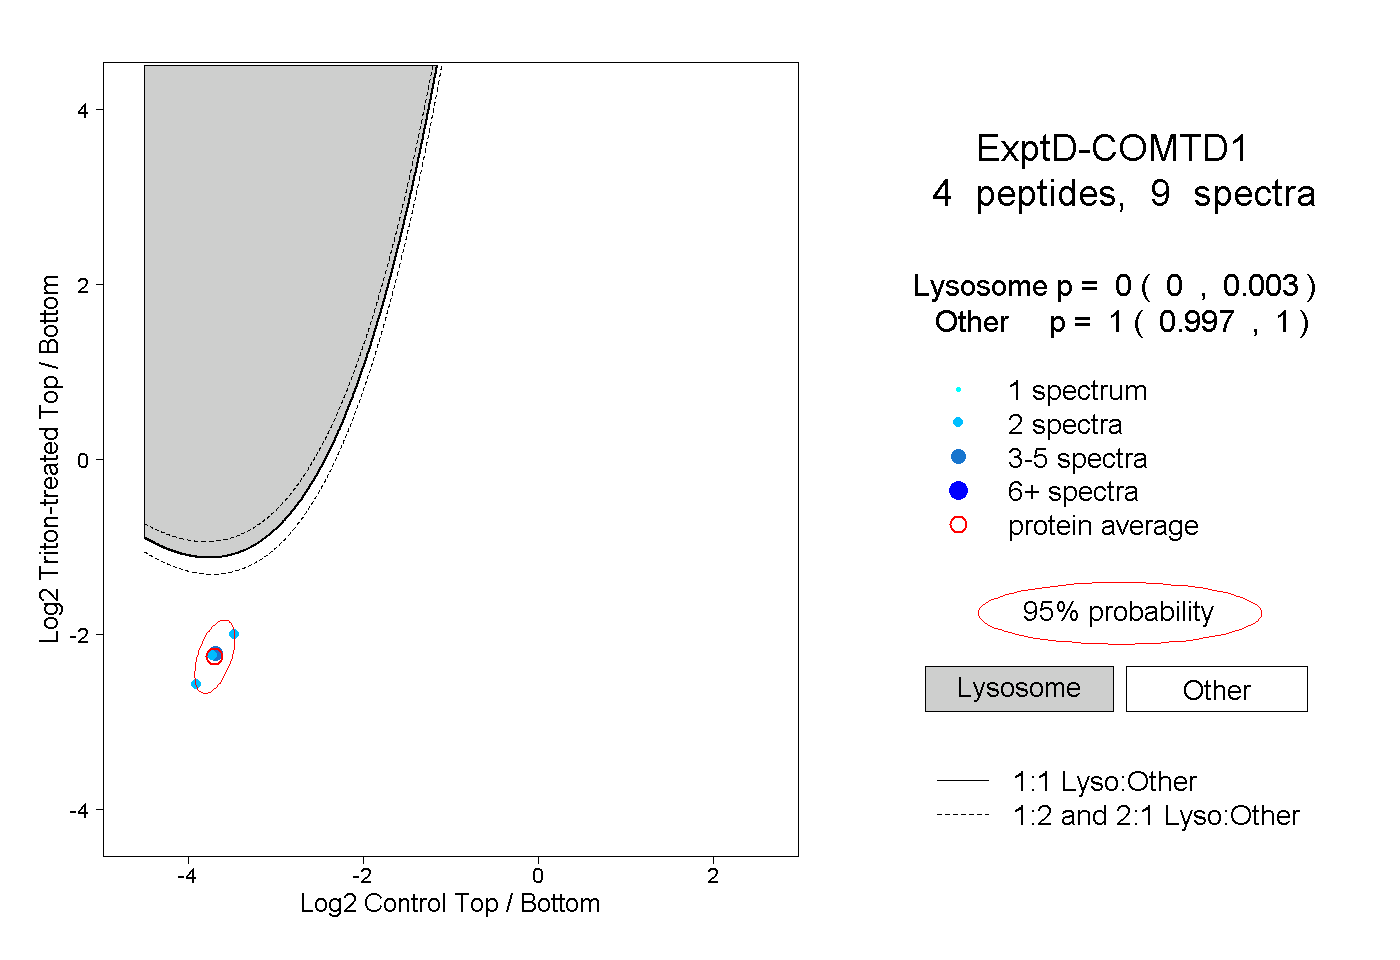 |
0.000 0.000 | 0.003 |
1.000 0.997 | 1.000 |