 3
3peptides
spectra

0.521 | 0.673
0.000 | 0.150
0.114 | 0.296
0.000 | 0.000
0.000 | 0.091
0.000 | 0.094
0.015 | 0.091
0.000 | 0.000
8peptides
spectra
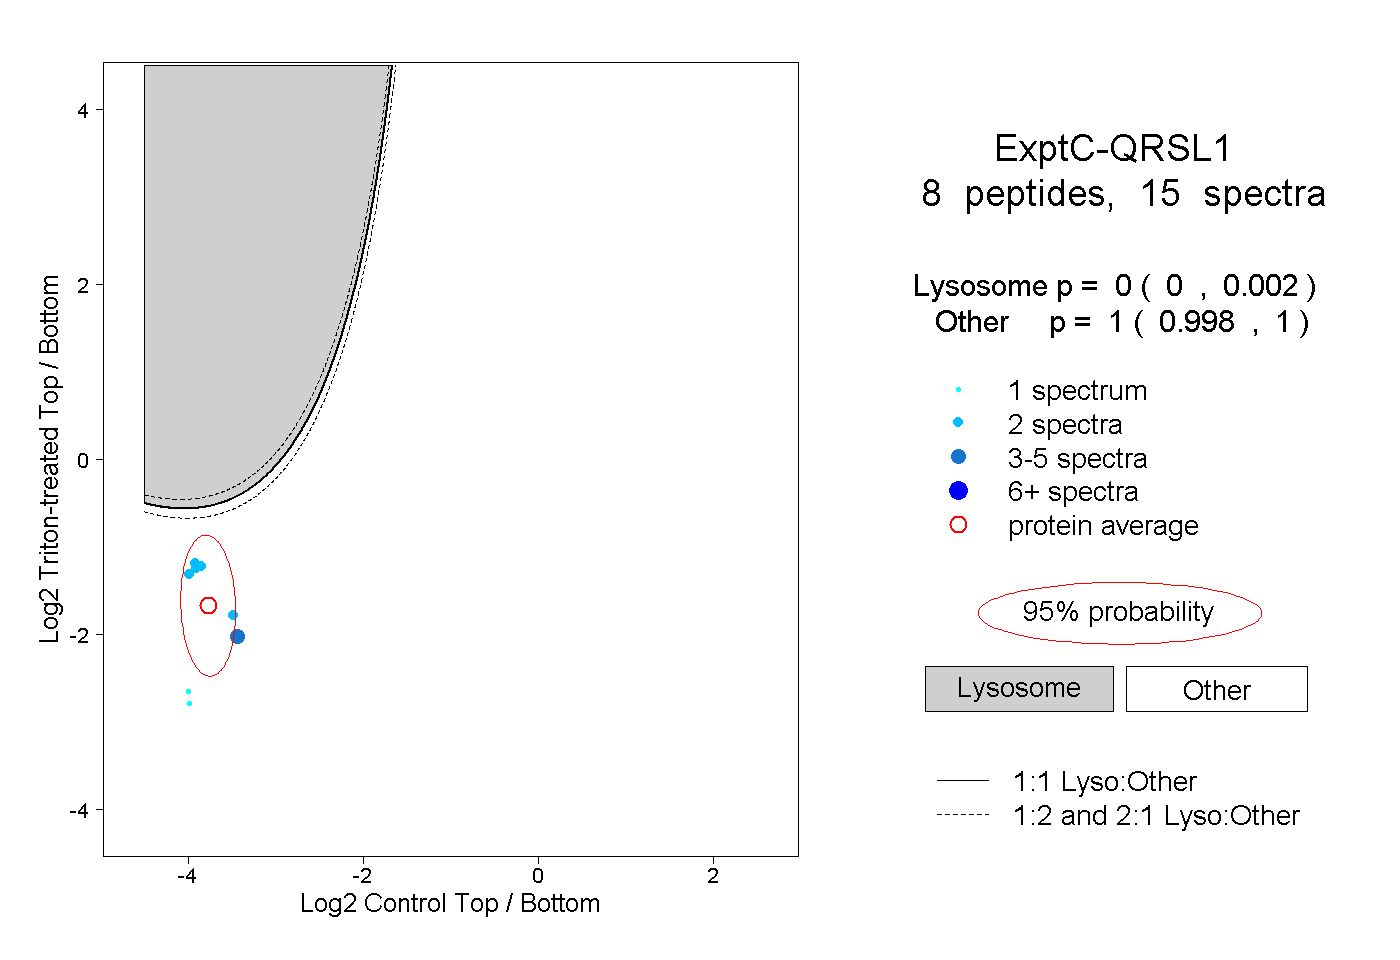
0.000 | 0.002
0.998 | 1.000
1peptide
spectrum

NA | NA
NA | NA