 3
3peptides
spectra

0.521 | 0.673
0.000 | 0.150
0.114 | 0.296
0.000 | 0.000
0.000 | 0.091
0.000 | 0.094
0.015 | 0.091
0.000 | 0.000
| Plot | Mito | Lyso | Perox | ER | Golgi | PM | Cytosol | Nucleus | |||||
| Expt A |
3 peptides |
3 spectra |
|
0.621 0.521 | 0.673 |
0.097 0.000 | 0.150 |
0.205 0.114 | 0.296 |
0.000 0.000 | 0.000 |
0.000 0.000 | 0.091 |
0.010 0.000 | 0.094 |
0.067 0.015 | 0.091 |
0.000 0.000 | 0.000 |
| 1 spectrum, ENYENYFVK | 0.607 | 0.095 | 0.190 | 0.000 | 0.000 | 0.000 | 0.108 | 0.000 | ||
| 1 spectrum, LLDQGALLMGK | 0.381 | 0.025 | 0.282 | 0.000 | 0.244 | 0.047 | 0.021 | 0.000 | ||
| 1 spectrum, GYLPPYNATVVQR | 0.779 | 0.000 | 0.221 | 0.000 | 0.000 | 0.000 | 0.000 | 0.000 |
| Plot | Lyso | Other | |||||||||||
| Expt C |
8 peptides |
15 spectra |
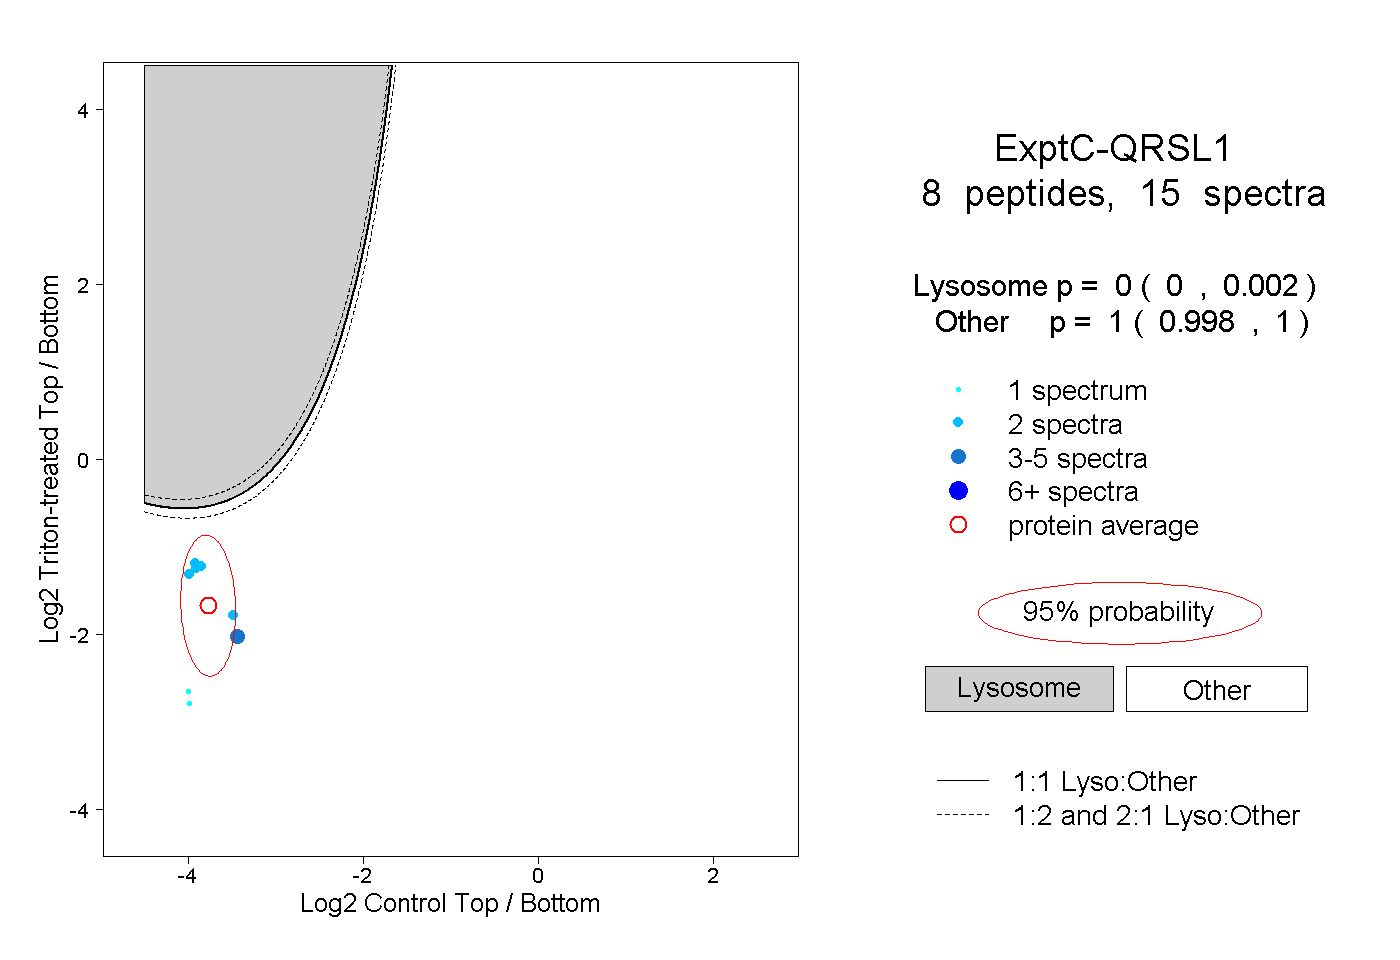 |
0.000 0.000 | 0.002 |
1.000 0.998 | 1.000 |
||||||||
| Plot | Lyso | Other | |||||||||||
| Expt D |
1 peptide |
1 spectrum |
 |
0.000 NA | NA |
1.000 NA | NA |