 4
4peptides
spectra
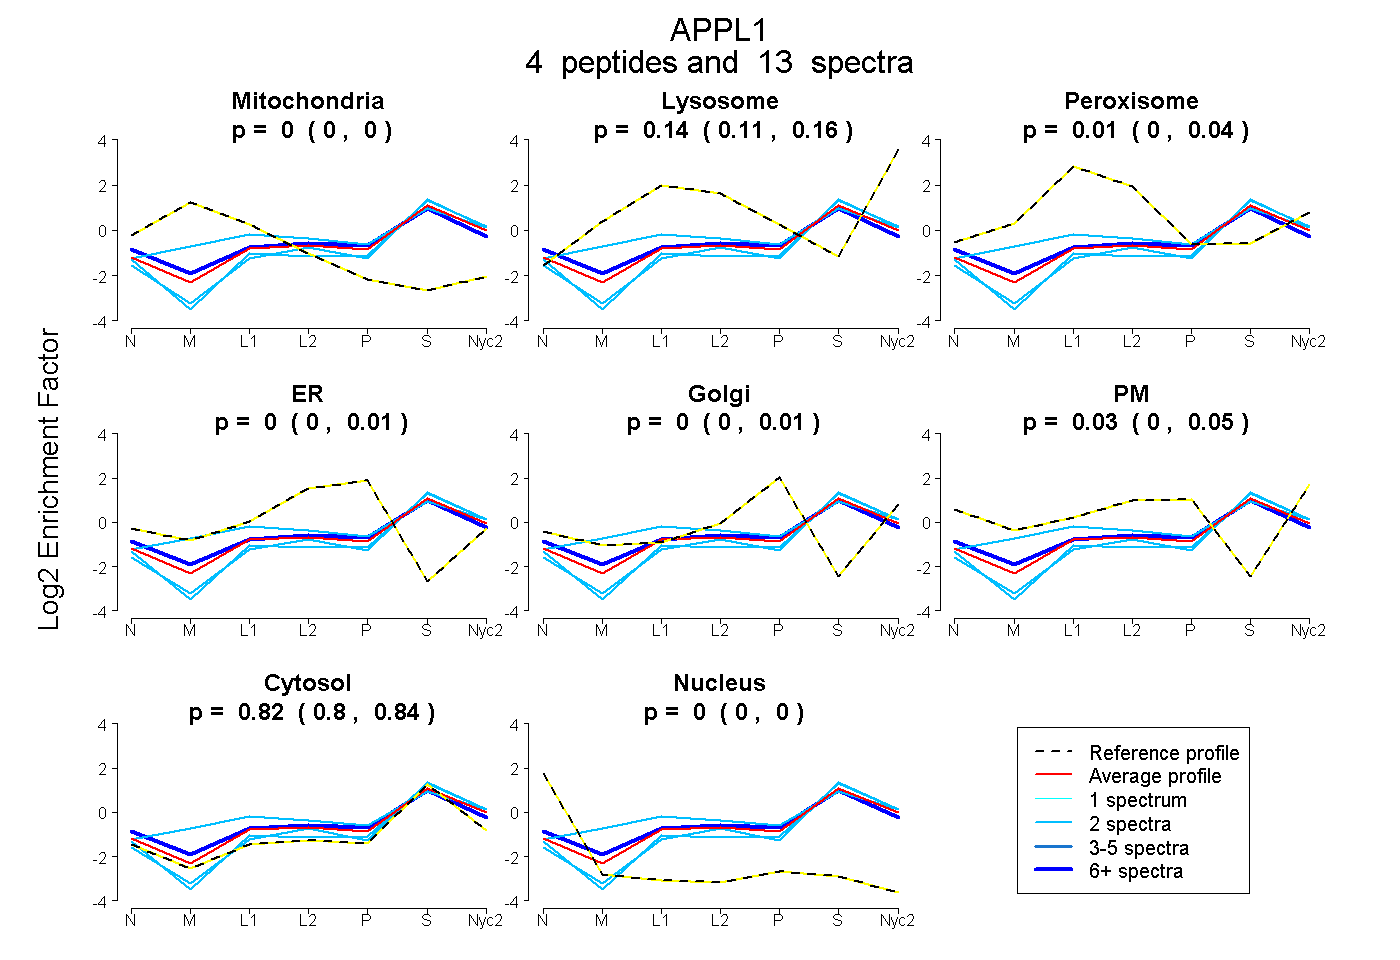
0.000 | 0.000
0.108 | 0.158
0.000 | 0.040
0.000 | 0.011
0.000 | 0.008
0.000 | 0.049
0.801 | 0.844
0.000 | 0.000
3peptides
spectra
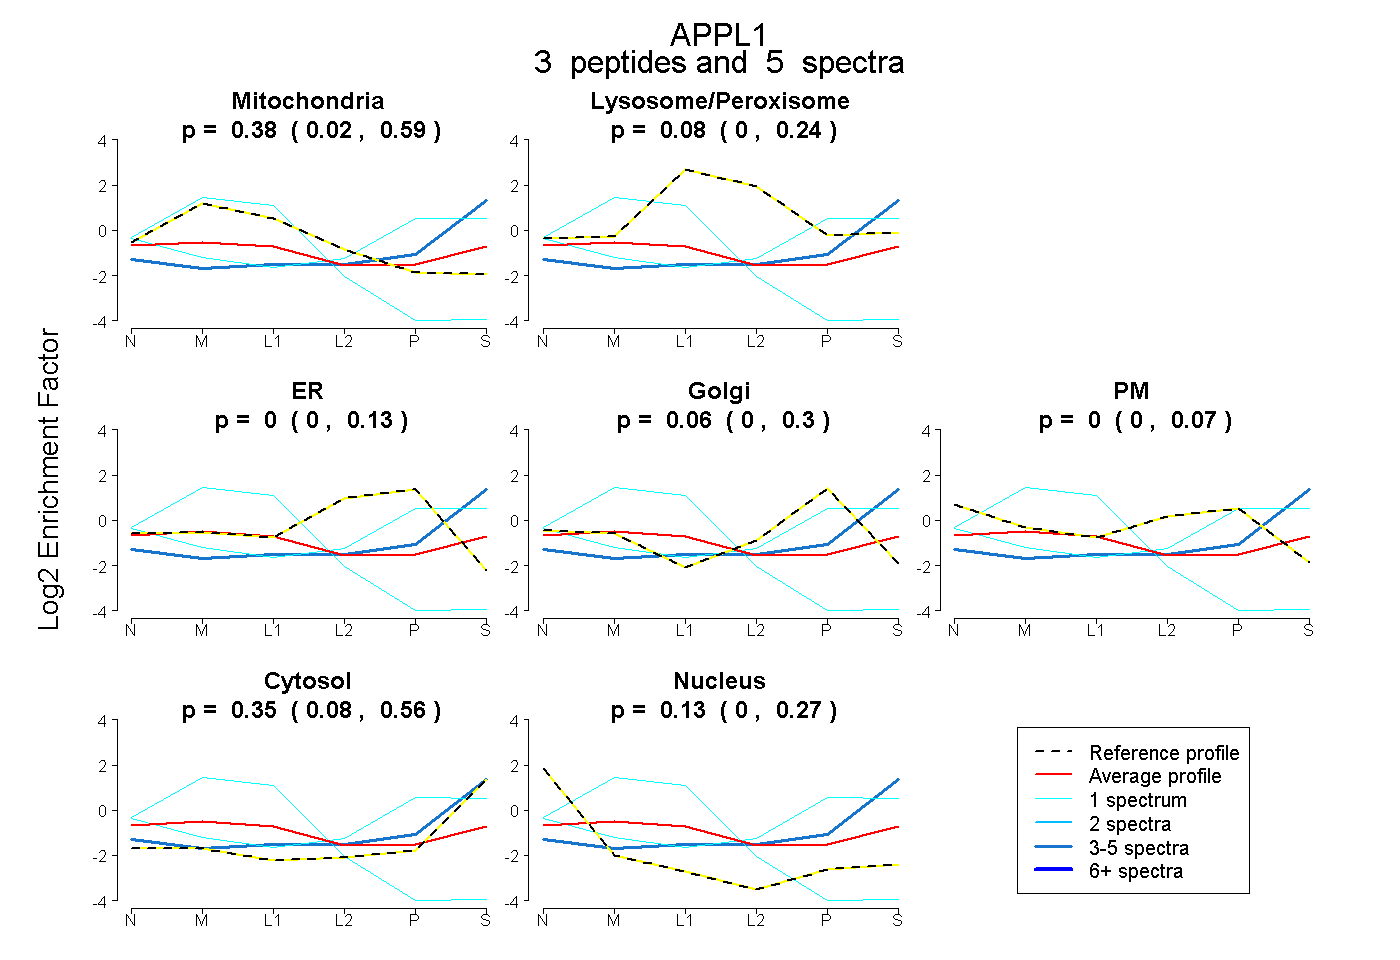
0.015 | 0.590
0.000 | 0.236
0.000 | 0.128
0.000 | 0.296
0.000 | 0.072
0.076 | 0.562
0.000 | 0.272
2peptides
spectra
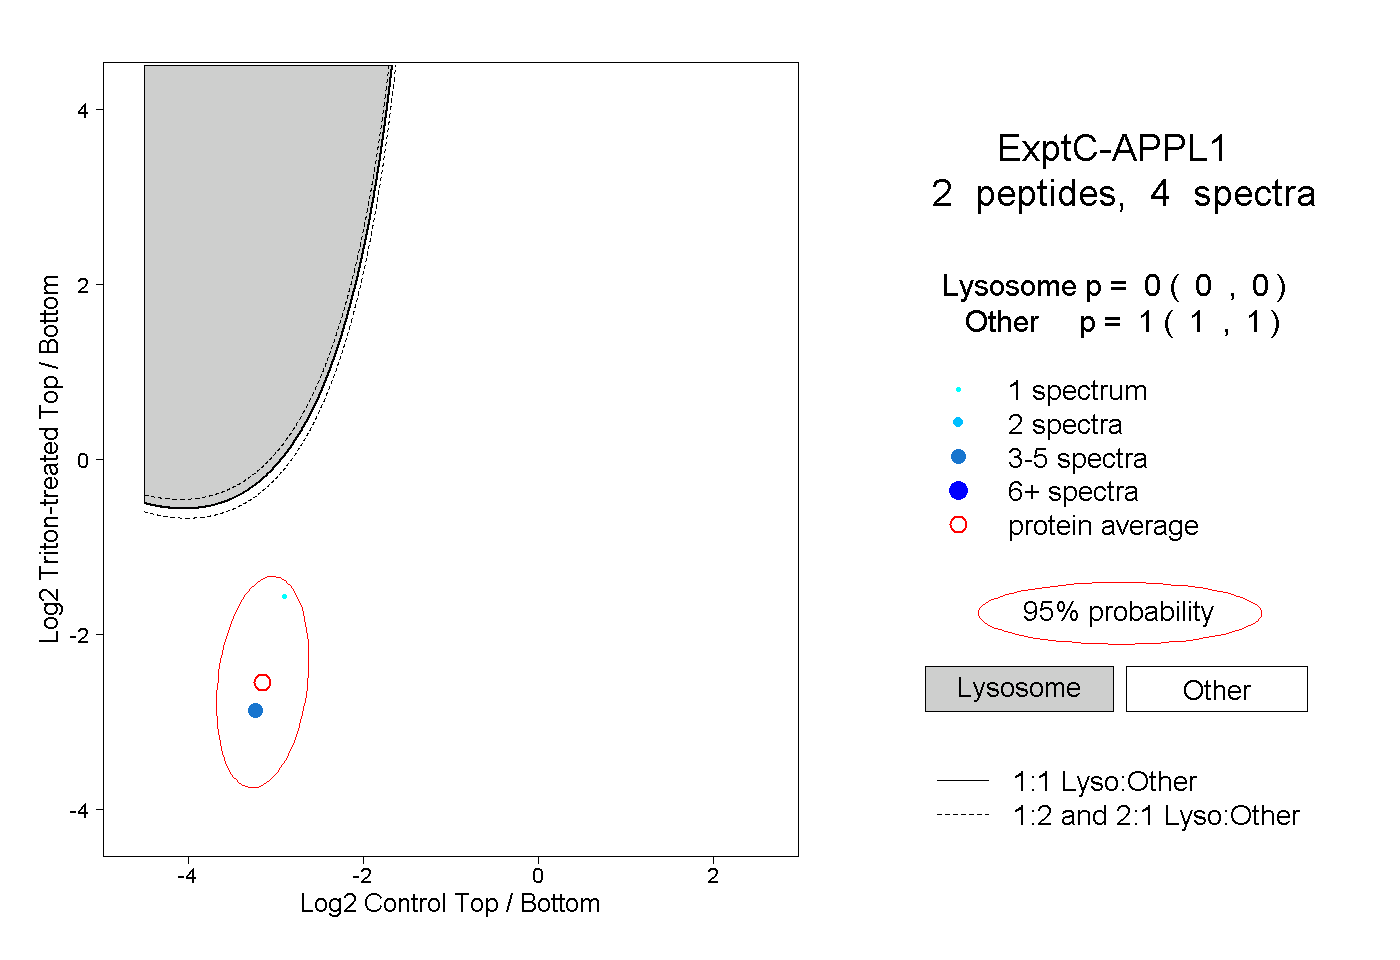
0.000 | 0.000
1.000 | 1.000