 4
4peptides
spectra
0.000 | 0.000
0.108 | 0.158
0.000 | 0.040
0.000 | 0.011
0.000 | 0.008
0.000 | 0.049
0.801 | 0.844
0.000 | 0.000
| Plot | Mito | Lyso | Perox | ER | Golgi | PM | Cytosol | Nucleus | |||||
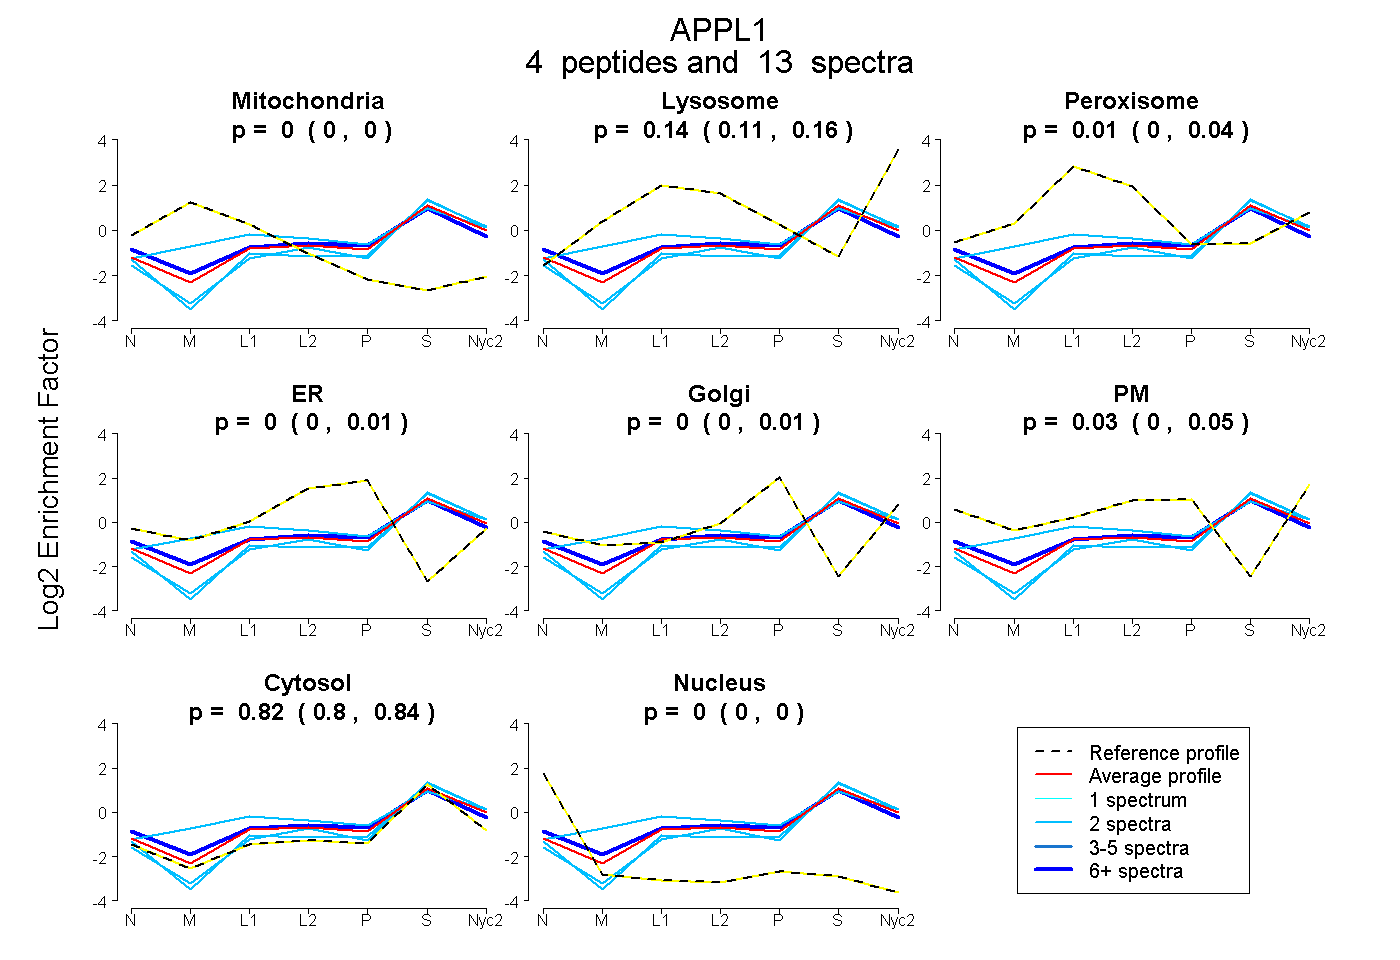
| Expt A |
4 peptides |
13 spectra |
|
0.000 0.000 | 0.000 |
0.138 0.108 | 0.158 |
0.009 0.000 | 0.040 |
0.000 0.000 | 0.011 |
0.000 0.000 | 0.008 |
0.029 0.000 | 0.049 |
0.824 0.801 | 0.844 |
0.000 0.000 | 0.000 |
| 2 spectra, SDDHPDVVYETMR | 0.029 | 0.182 | 0.170 | 0.000 | 0.000 | 0.000 | 0.619 | 0.000 | ||
| 2 spectra, QILAAR | 0.000 | 0.078 | 0.000 | 0.000 | 0.000 | 0.000 | 0.922 | 0.000 | ||
| 2 spectra, LIDPQTQVTR | 0.000 | 0.063 | 0.000 | 0.000 | 0.000 | 0.000 | 0.937 | 0.000 | ||
| 7 spectra, AIHNIFR | 0.000 | 0.002 | 0.113 | 0.000 | 0.000 | 0.125 | 0.760 | 0.000 |
| Plot | Mito | Lyso or Perox | ER | Golgi | PM | Cytosol | Nucleus | ||||||
| Expt B |
3 peptides |
5 spectra |
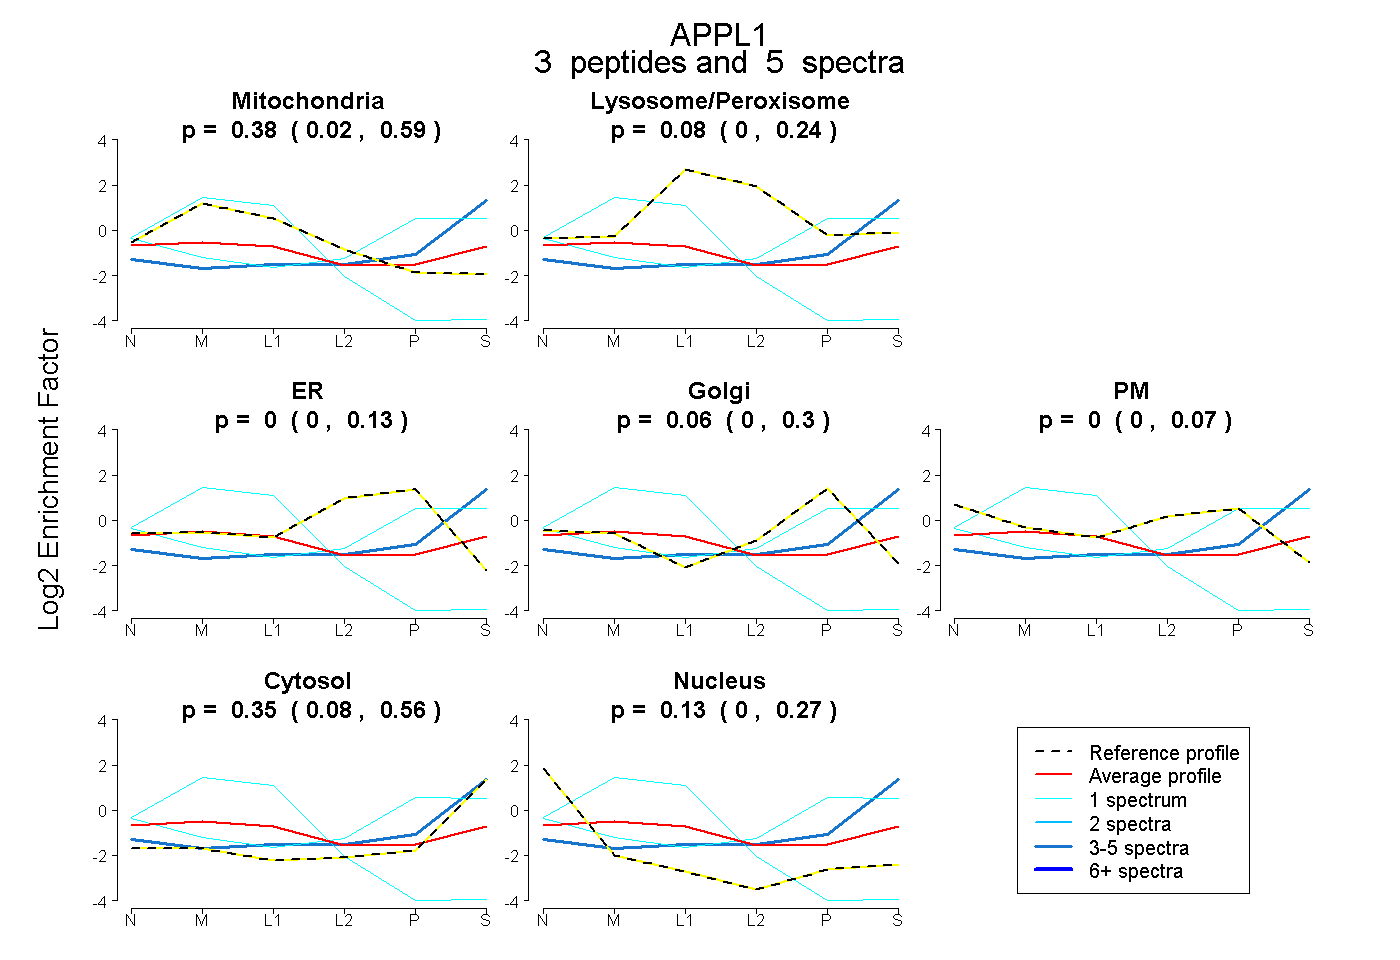 |
0.377 0.015 | 0.590 |
0.079 0.000 | 0.236 |
0.000 0.000 | 0.128 |
0.064 0.000 | 0.296 |
0.000 0.000 | 0.072 |
0.354 0.076 | 0.562 |
0.126 0.000 | 0.272 |
|||
| Plot | Lyso | Other | |||||||||||
| Expt C |
2 peptides |
4 spectra |
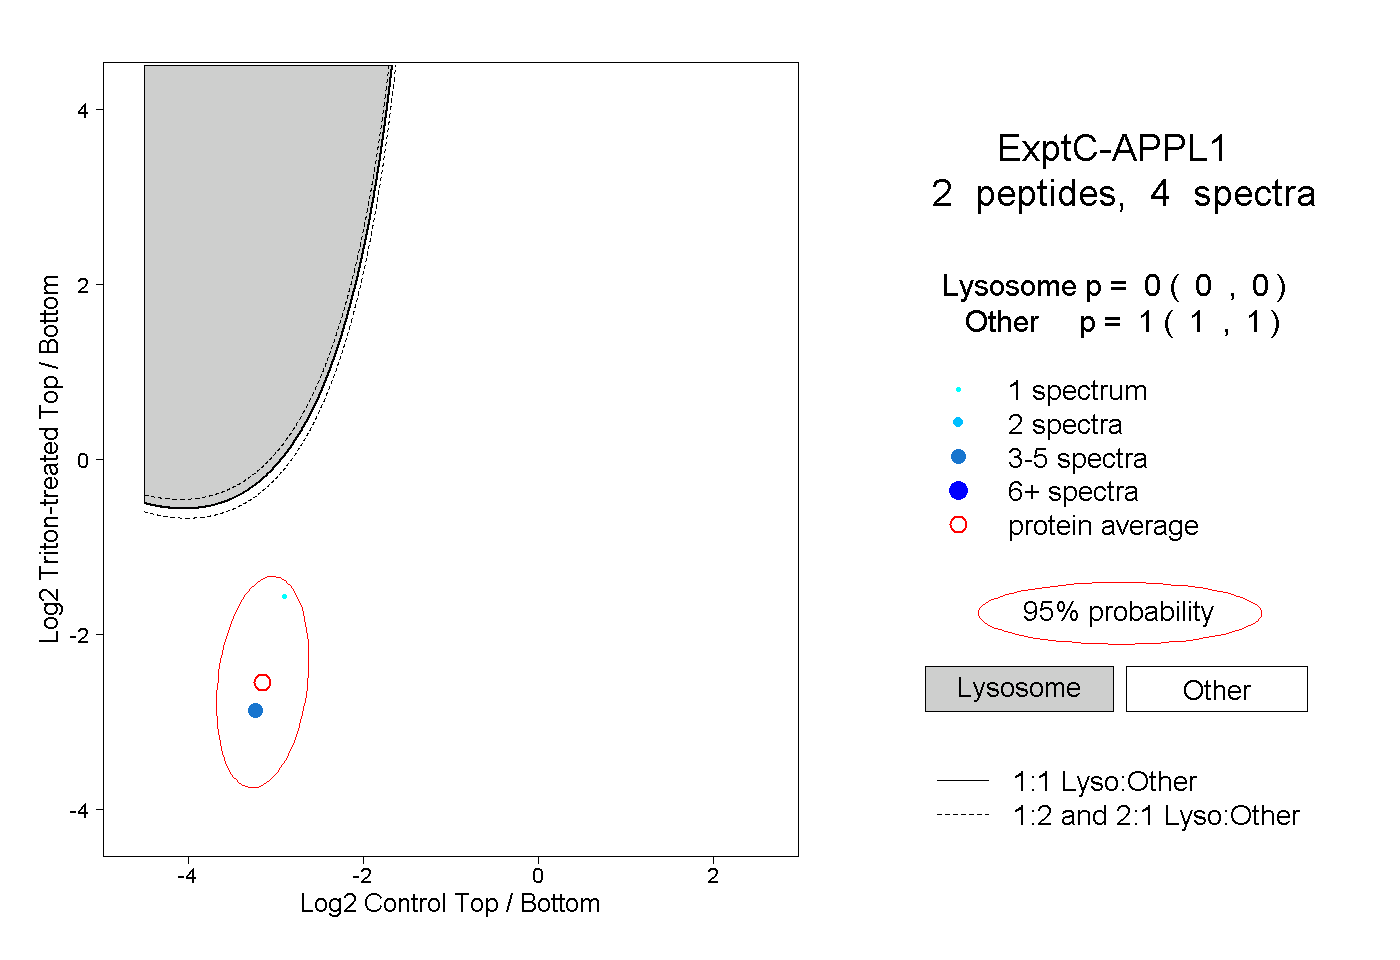 |
0.000 0.000 | 0.000 |
1.000 1.000 | 1.000 |