 18
18peptides
spectra
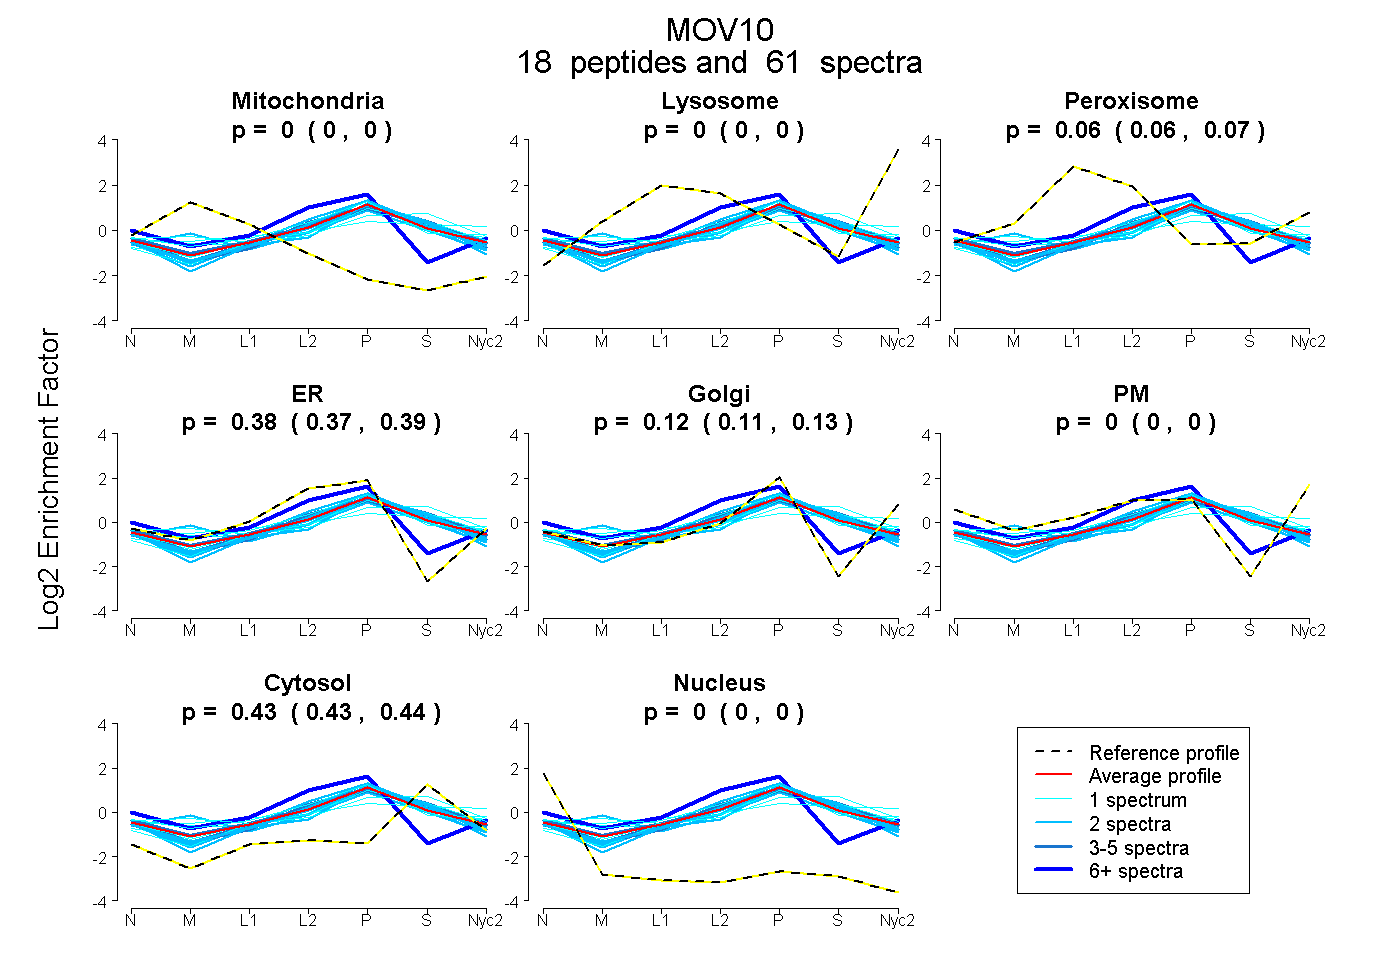
0.000 | 0.000
0.000 | 0.000
0.059 | 0.069
0.368 | 0.393
0.108 | 0.131
0.000 | 0.000
0.428 | 0.438
0.000 | 0.000
7peptides
spectra
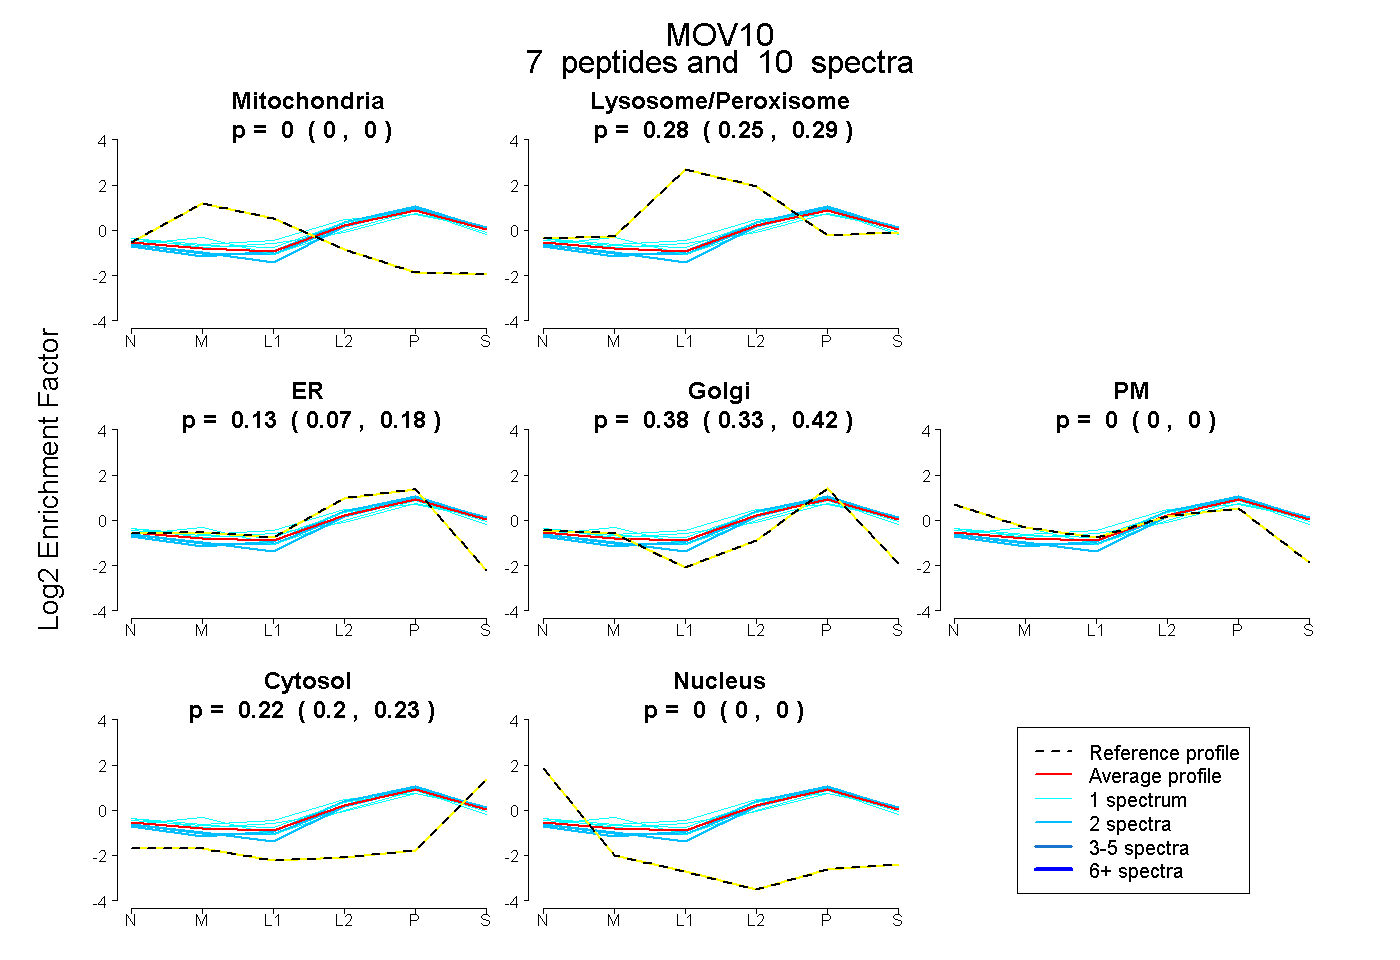
0.000 | 0.000
0.250 | 0.294
0.074 | 0.176
0.331 | 0.420
0.000 | 0.000
0.202 | 0.230
0.000 | 0.000
21peptides
spectra
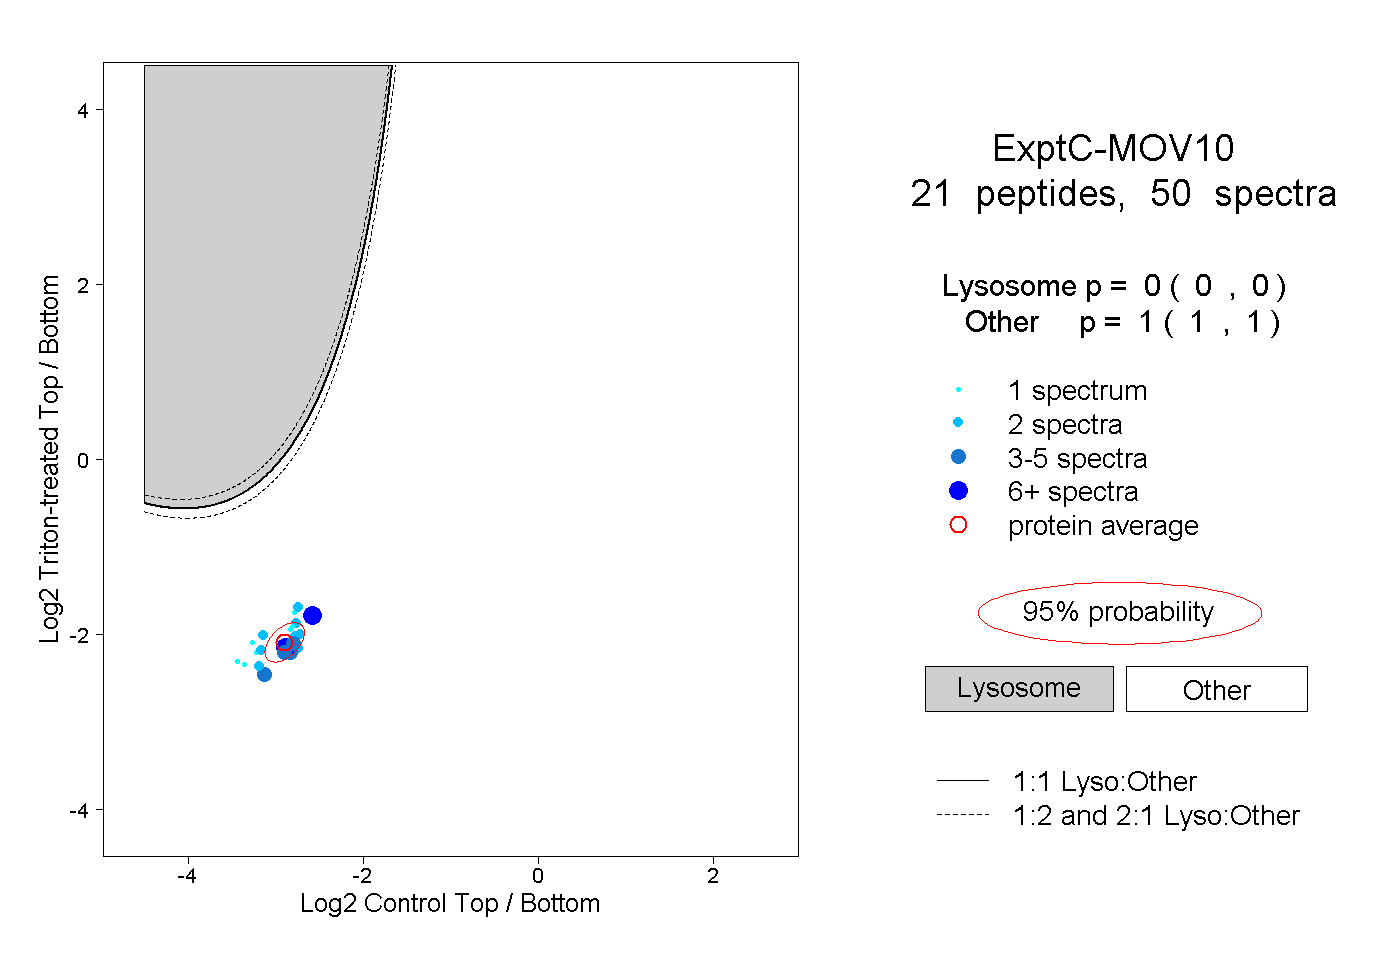
0.000 | 0.000
1.000 | 1.000
2peptides
spectra

NA | NA
NA | NA