MOV10
[ENSRNOP00000018061]
Main page
| | | Plot |
Mito |
Lyso |
|
Perox |
ER |
Golgi |
PM |
Cytosol |
Nucleus |
|
| Expt A |
 18
18
peptides |
61
spectra |
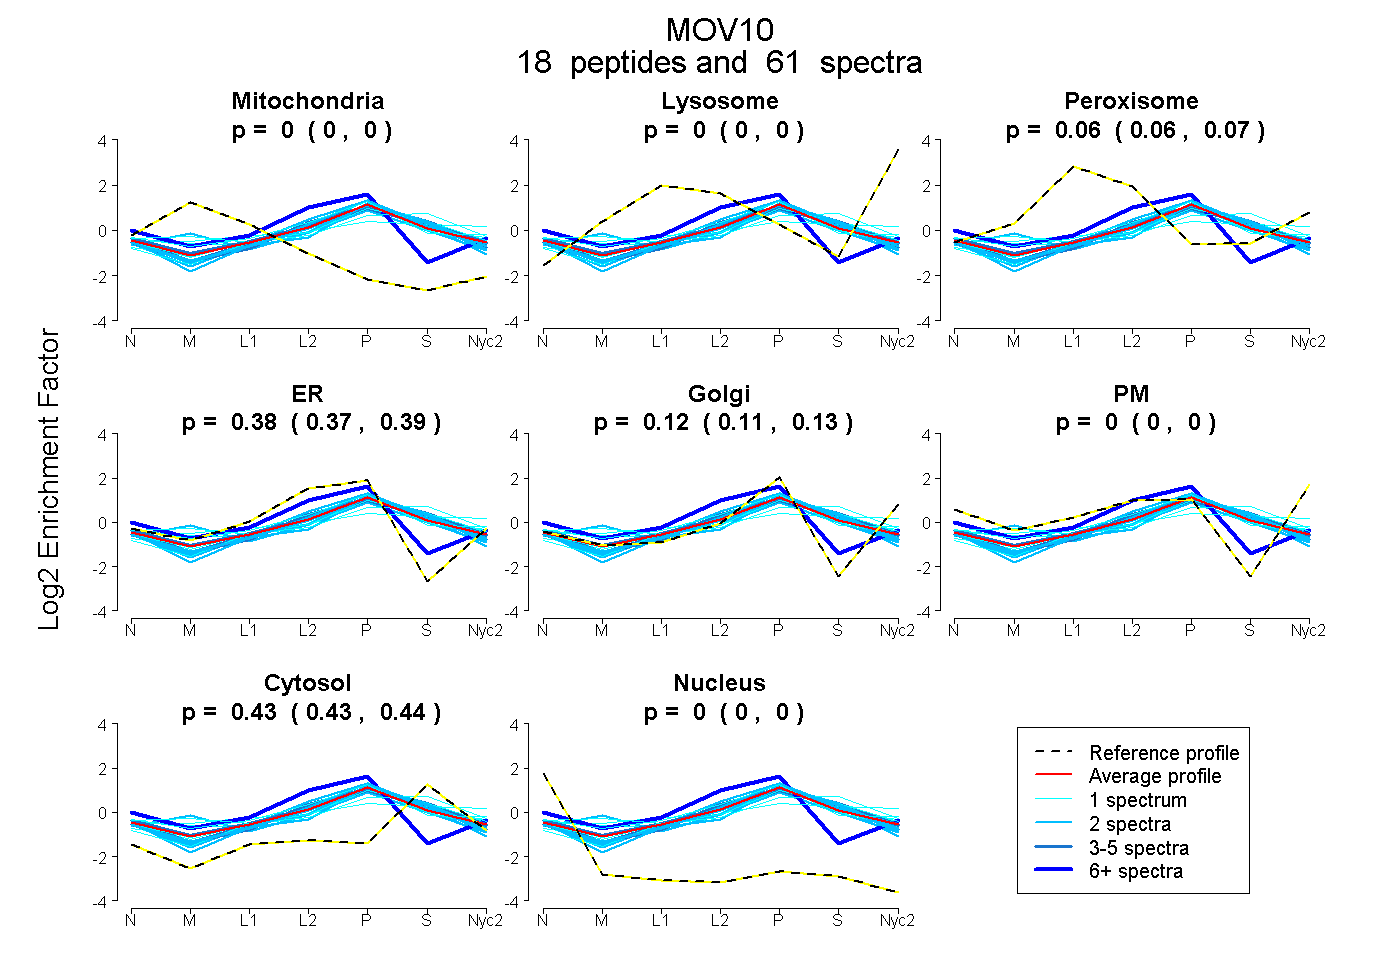 |
0.000
0.000 | 0.000 |
0.000
0.000 | 0.000 |
|
0.064
0.059 | 0.069 |
0.382
0.368 | 0.393 |
0.121
0.108 | 0.131 |
0.000
0.000 | 0.000 |
0.434
0.428 | 0.438 |
0.000
0.000 | 0.000 |
|
| | | Plot |
Mito |
|
Lyso or Perox |
|
ER |
Golgi |
PM |
Cytosol |
Nucleus |
|
| Expt B |
7
peptides |
10
spectra |
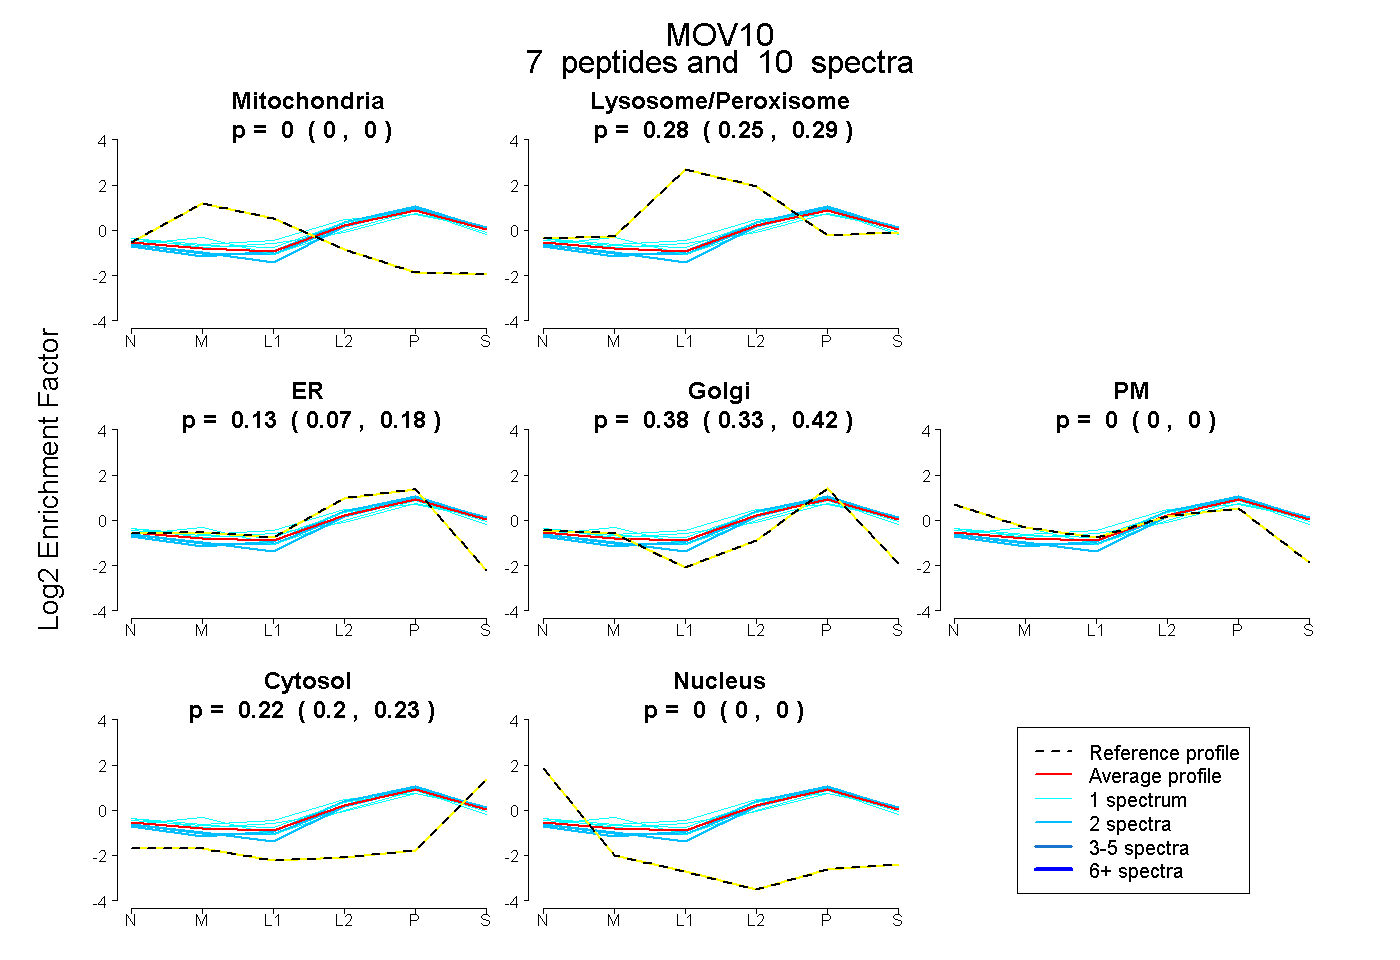 |
0.000
0.000 | 0.000 |
|
0.276
0.250 | 0.294 |
|
0.126
0.074 | 0.176 |
0.381
0.331 | 0.420 |
0.000
0.000 | 0.000 |
0.217
0.202 | 0.230 |
0.000
0.000 | 0.000 |
|
| 1 spectrum, IKPGSSISK |
0.000 |
|
0.346 |
|
0.000 |
0.436 |
0.000 |
0.218 |
0.000 |
|
| 1 spectrum, VNFTFNR |
0.000 |
|
0.319 |
|
0.101 |
0.408 |
0.000 |
0.172 |
0.000 |
|
| 2 spectra, LIASPR |
0.000 |
|
0.195 |
|
0.279 |
0.271 |
0.000 |
0.255 |
0.000 |
|
| 2 spectra, IEEGERPDR |
0.000 |
|
0.179 |
|
0.405 |
0.138 |
0.000 |
0.278 |
0.000 |
|
| 1 spectrum, EVLTLR |
0.000 |
|
0.404 |
|
0.033 |
0.398 |
0.000 |
0.166 |
0.000 |
|
| 1 spectrum, LSFSPSLLSR |
0.000 |
|
0.277 |
|
0.000 |
0.554 |
0.000 |
0.169 |
0.000 |
|
| 2 spectra, SVILISTVR |
0.000 |
|
0.120 |
|
0.369 |
0.199 |
0.000 |
0.312 |
0.000 |
|
| | | Plot |
|
Lyso |
|
|
|
|
|
|
|
Other |
| Expt C |
21
peptides |
50
spectra |
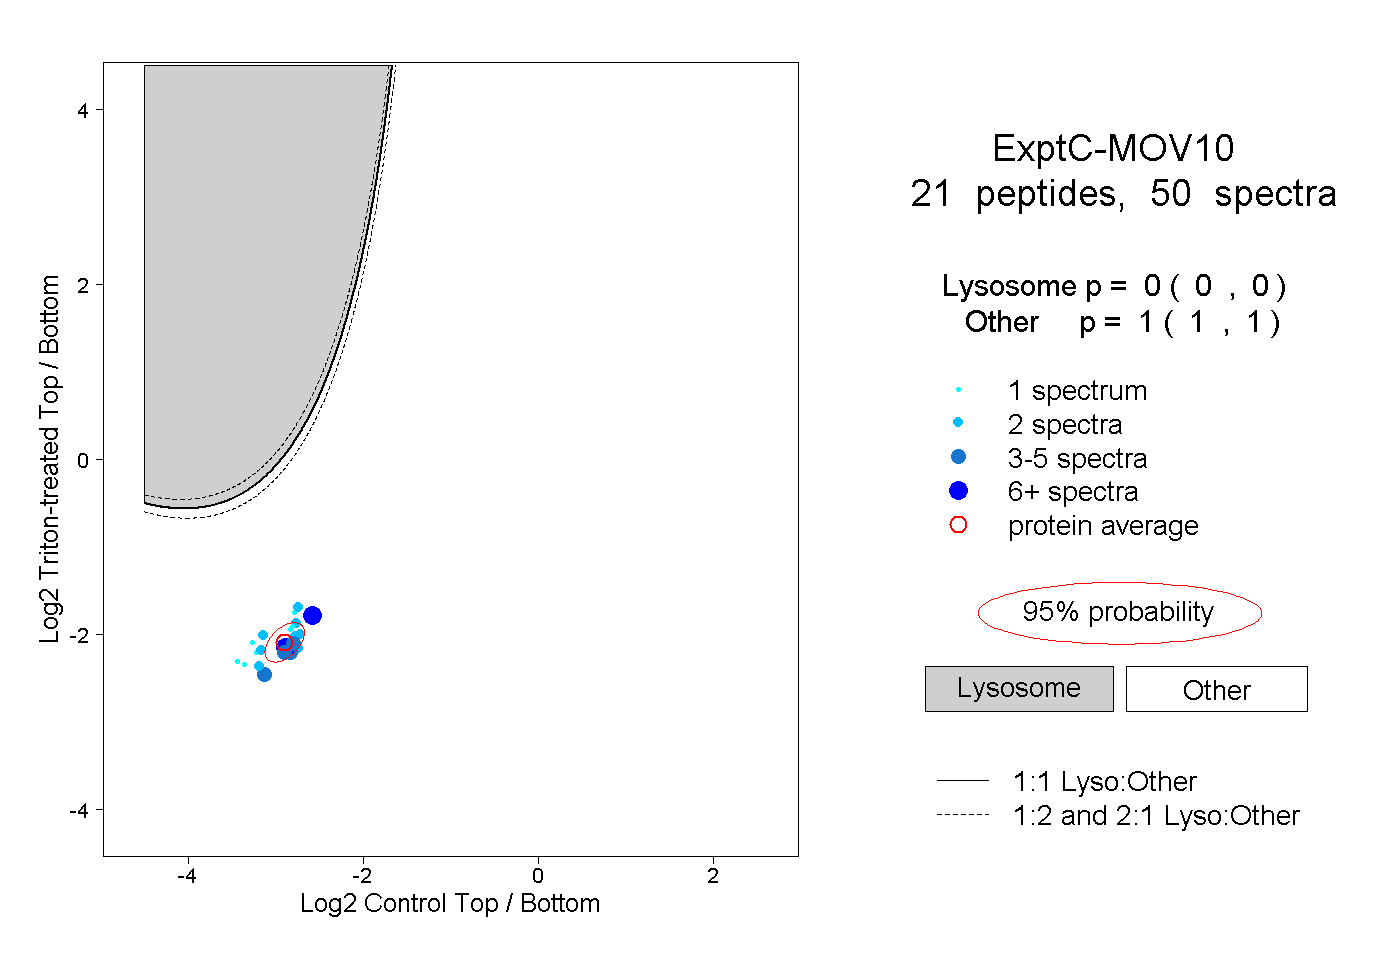 |
|
0.000
0.000 | 0.000 |
|
|
|
|
|
|
|
1.000
1.000 | 1.000 |
| | | Plot |
|
Lyso |
|
|
|
|
|
|
|
Other |
| Expt D |
2
peptides |
2
spectra |
 |
|
0.000
NA | NA |
|
|
|
|
|
|
|
1.000
NA | NA |