 7
7peptides
spectra

0.000 | 0.000
0.229 | 0.282
0.000 | 0.000
0.000 | 0.000
0.200 | 0.267
0.000 | 0.077
0.457 | 0.485
0.000 | 0.000
5peptides
spectra
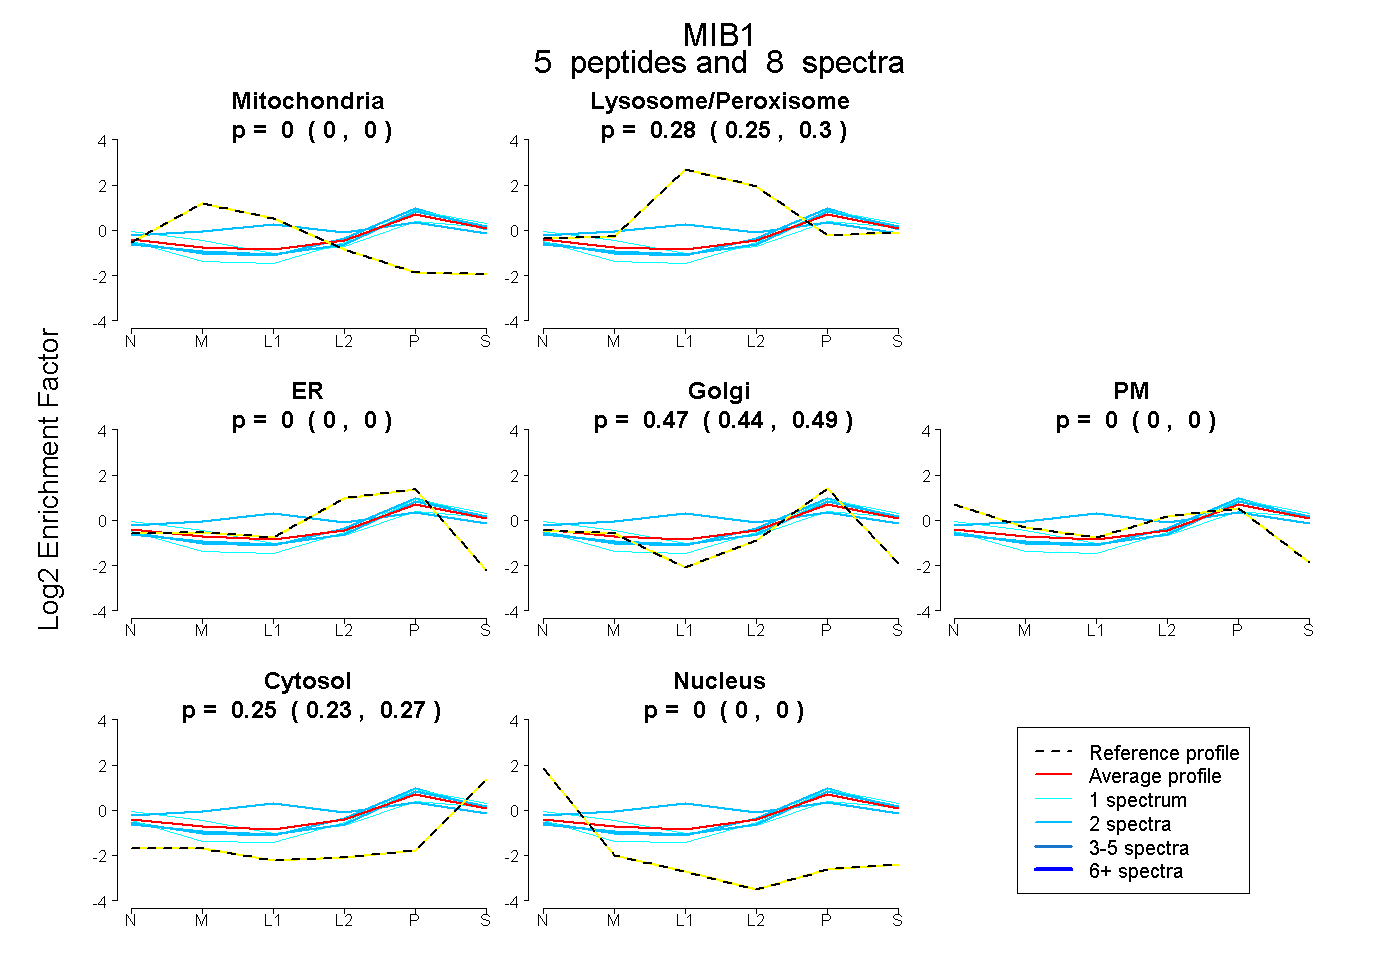
0.000 | 0.000
0.248 | 0.303
0.000 | 0.000
0.443 | 0.490
0.000 | 0.000
0.235 | 0.269
0.000 | 0.000
9peptides
spectra

0.000 | 0.805
0.174 | 1.000
2peptides
spectra
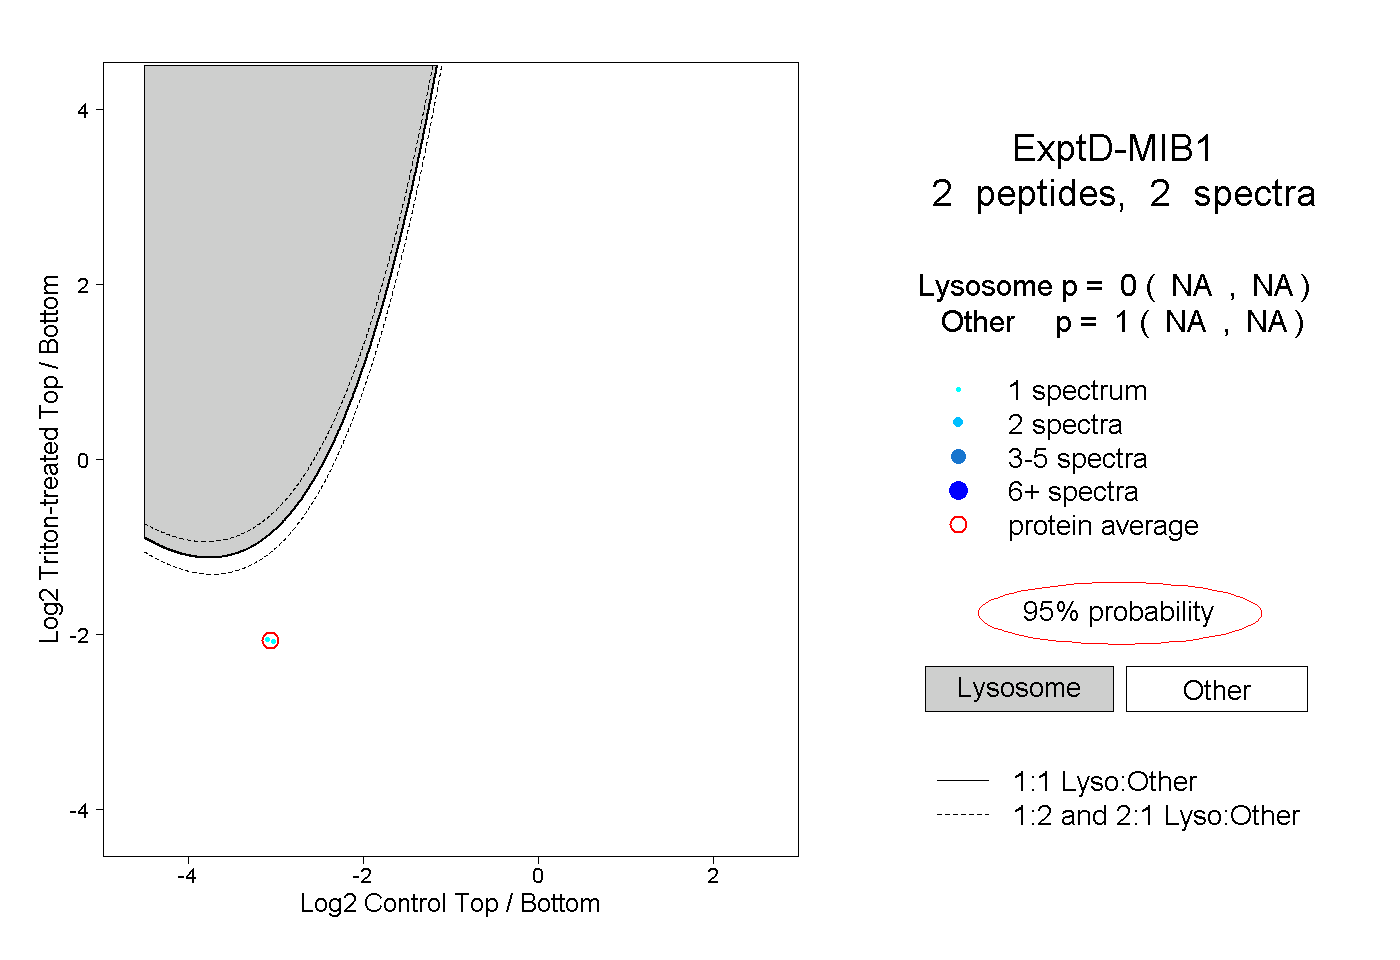
NA | NA
NA | NA