 7
7peptides
spectra

0.000 | 0.000
0.229 | 0.282
0.000 | 0.000
0.000 | 0.000
0.200 | 0.267
0.000 | 0.077
0.457 | 0.485
0.000 | 0.000
| Plot | Mito | Lyso | Perox | ER | Golgi | PM | Cytosol | Nucleus | |||||
| Expt A |
7 peptides |
12 spectra |
|
0.000 0.000 | 0.000 |
0.262 0.229 | 0.282 |
0.000 0.000 | 0.000 |
0.000 0.000 | 0.000 |
0.245 0.200 | 0.267 |
0.021 0.000 | 0.077 |
0.472 0.457 | 0.485 |
0.000 0.000 | 0.000 |
| 2 spectra, QQPIIGIR | 0.000 | 0.293 | 0.000 | 0.000 | 0.168 | 0.000 | 0.539 | 0.000 | ||
| 1 spectrum, VAPAGSTISNASGER | 0.000 | 0.203 | 0.000 | 0.000 | 0.000 | 0.478 | 0.319 | 0.000 | ||
| 2 spectra, GIFAGAR | 0.000 | 0.207 | 0.000 | 0.000 | 0.257 | 0.000 | 0.536 | 0.000 | ||
| 2 spectra, VLLESR | 0.000 | 0.280 | 0.000 | 0.000 | 0.169 | 0.000 | 0.551 | 0.000 | ||
| 2 spectra, AVHHAAFGDEGAVIEVLHR | 0.000 | 0.250 | 0.090 | 0.000 | 0.213 | 0.038 | 0.410 | 0.000 | ||
| 2 spectra, QDGGEGHVGTVR | 0.000 | 0.271 | 0.000 | 0.000 | 0.153 | 0.138 | 0.437 | 0.000 | ||
| 1 spectrum, LFETQESGDLNEELVK | 0.000 | 0.000 | 0.000 | 0.394 | 0.133 | 0.000 | 0.473 | 0.000 |
| Plot | Mito | Lyso or Perox | ER | Golgi | PM | Cytosol | Nucleus | ||||||
| Expt B |
5 peptides |
8 spectra |
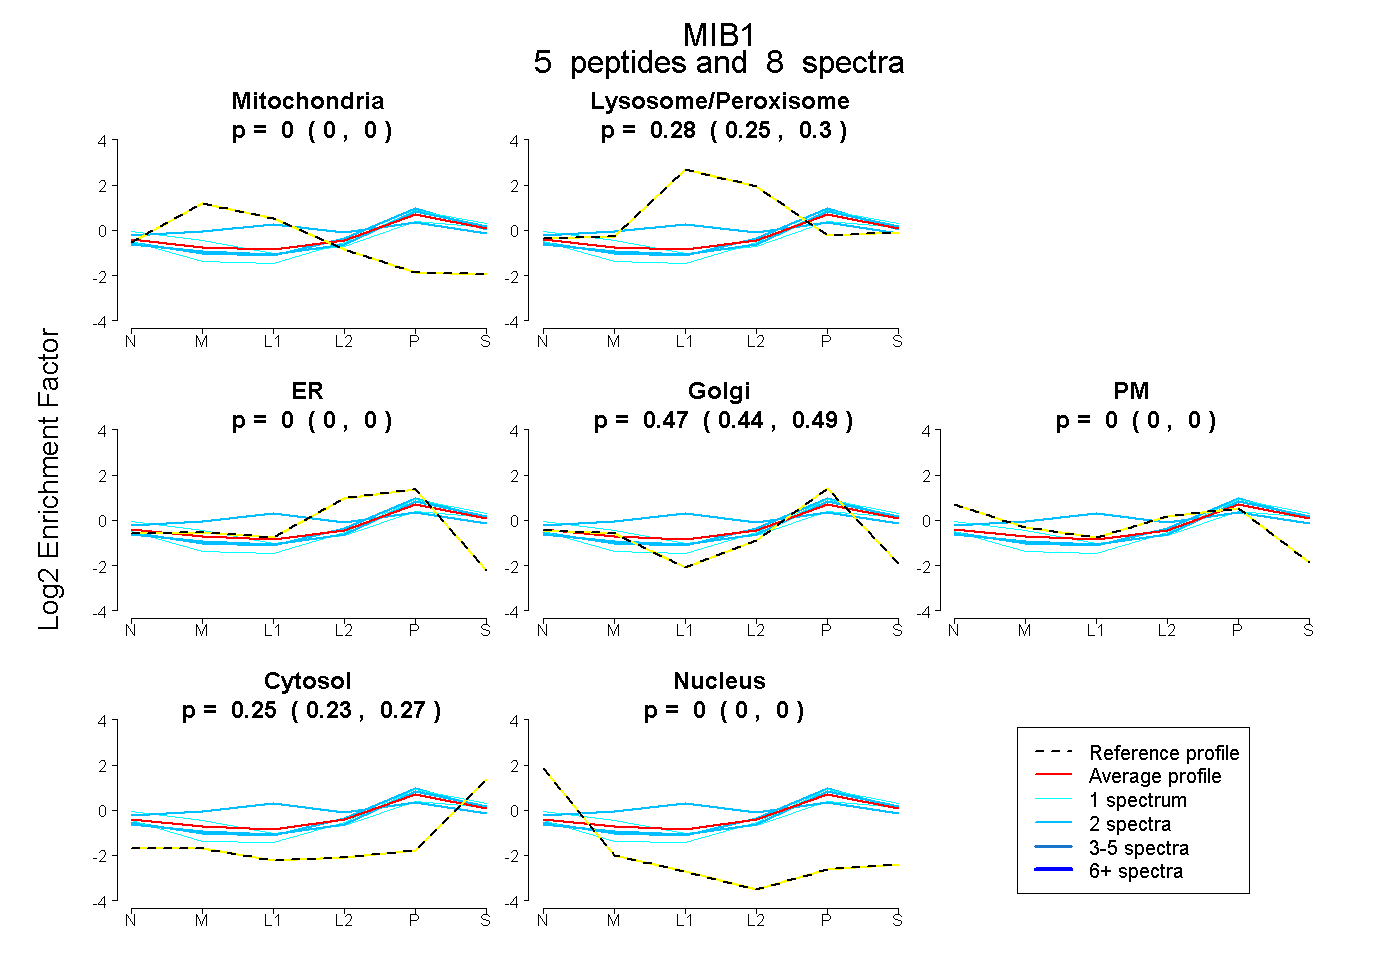 |
0.000 0.000 | 0.000 |
0.277 0.248 | 0.303 |
0.000 0.000 | 0.000 |
0.470 0.443 | 0.490 |
0.000 0.000 | 0.000 |
0.253 0.235 | 0.269 |
0.000 0.000 | 0.000 |
|||
| Plot | Lyso | Other | |||||||||||
| Expt C |
9 peptides |
17 spectra |
 |
0.009 0.000 | 0.805 |
0.991 0.174 | 1.000 |
||||||||
| Plot | Lyso | Other | |||||||||||
| Expt D |
2 peptides |
2 spectra |
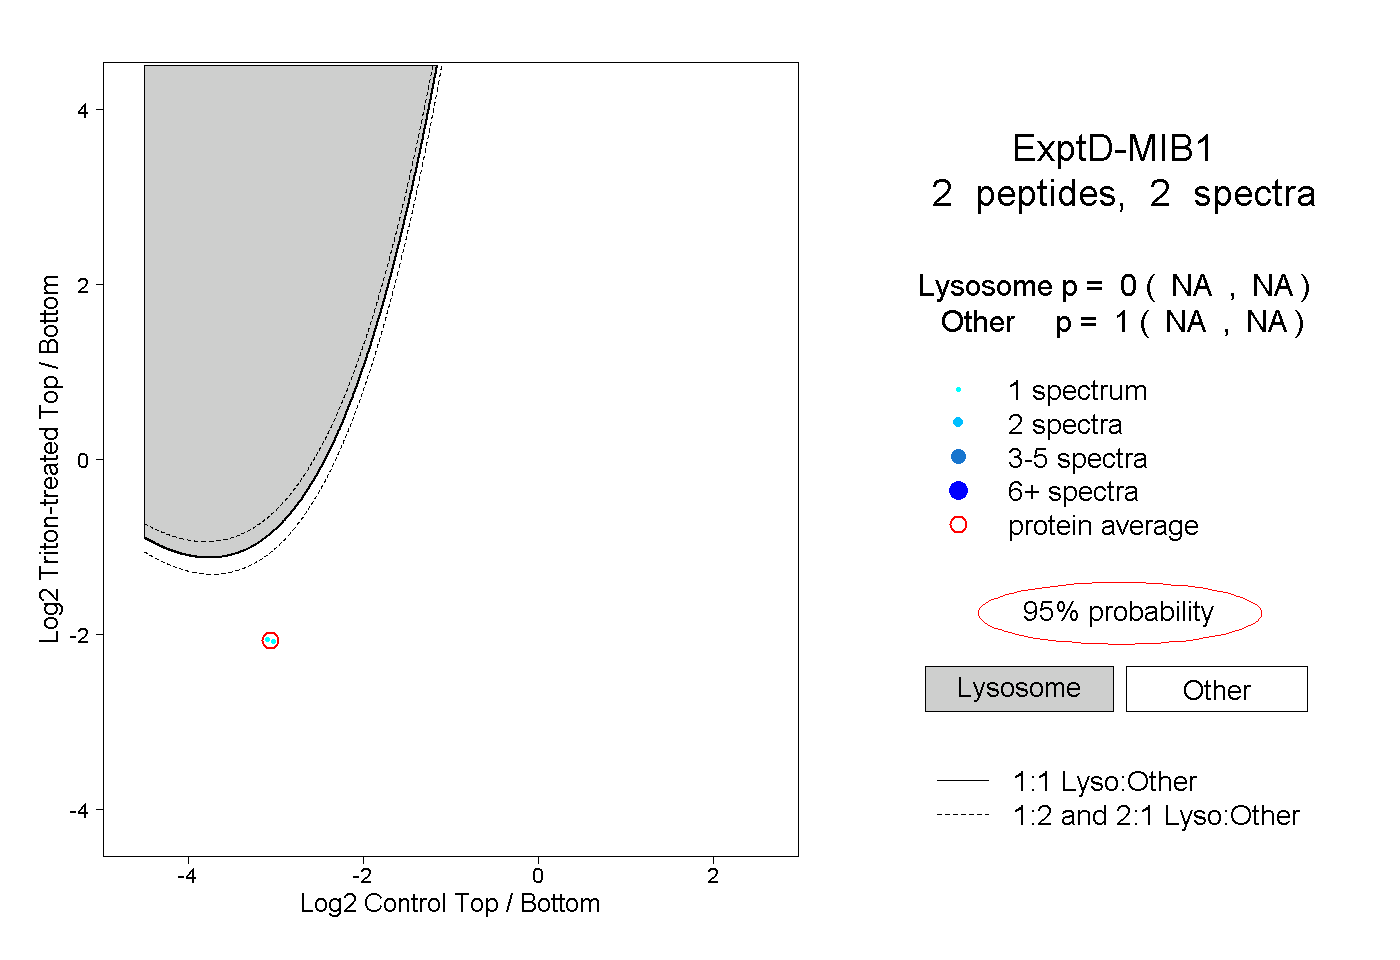 |
0.000 NA | NA |
1.000 NA | NA |