 6
6peptides
spectra
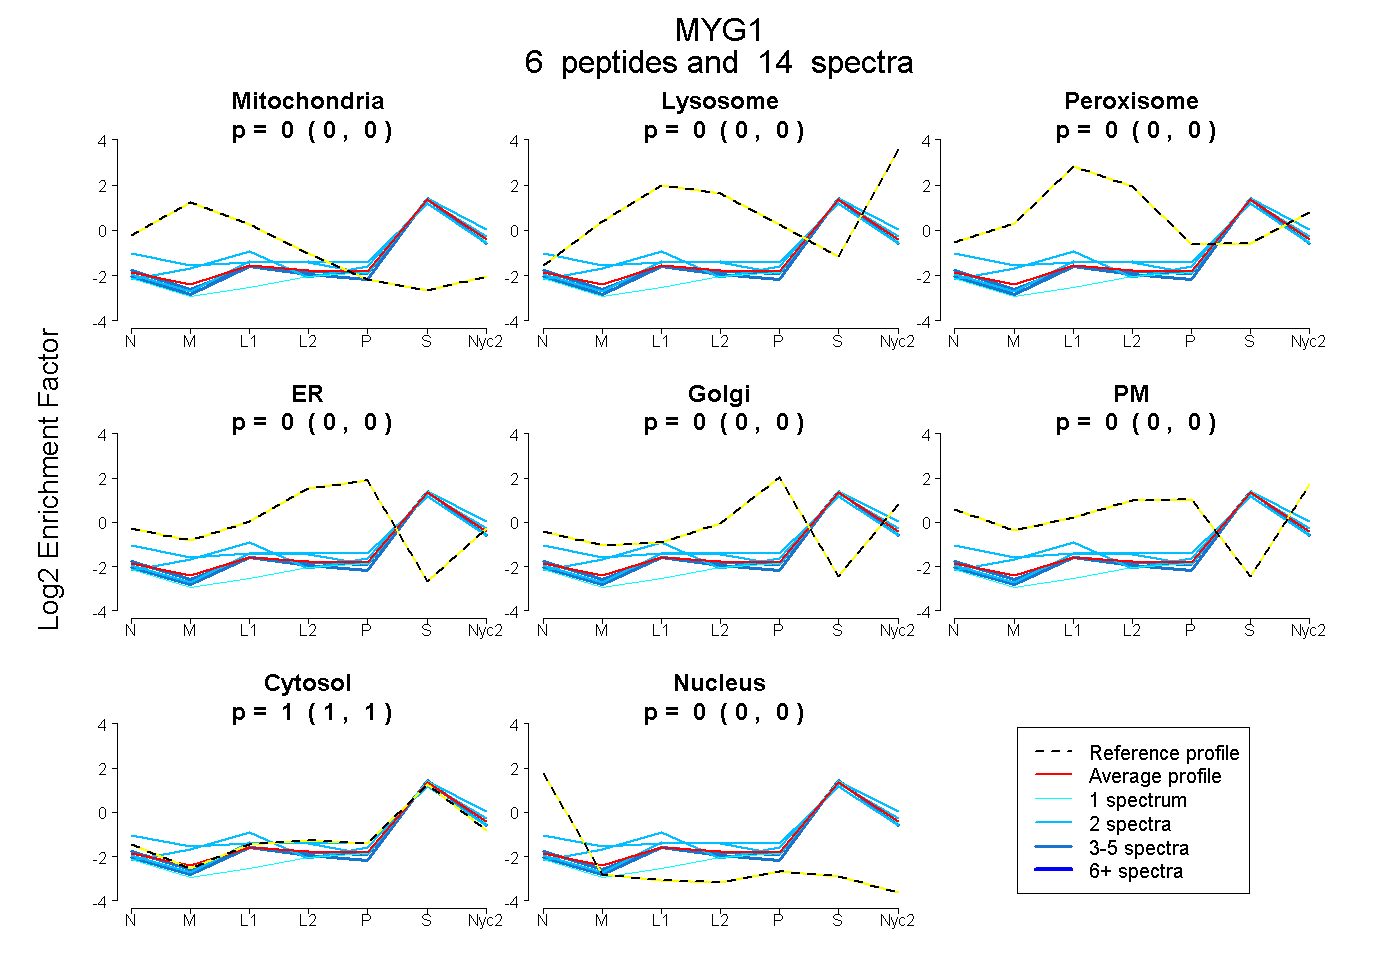
0.000 | 0.000
0.000 | 0.000
0.000 | 0.000
0.000 | 0.000
0.000 | 0.000
0.000 | 0.000
0.999 | 1.000
0.000 | 0.000
3peptides
spectra
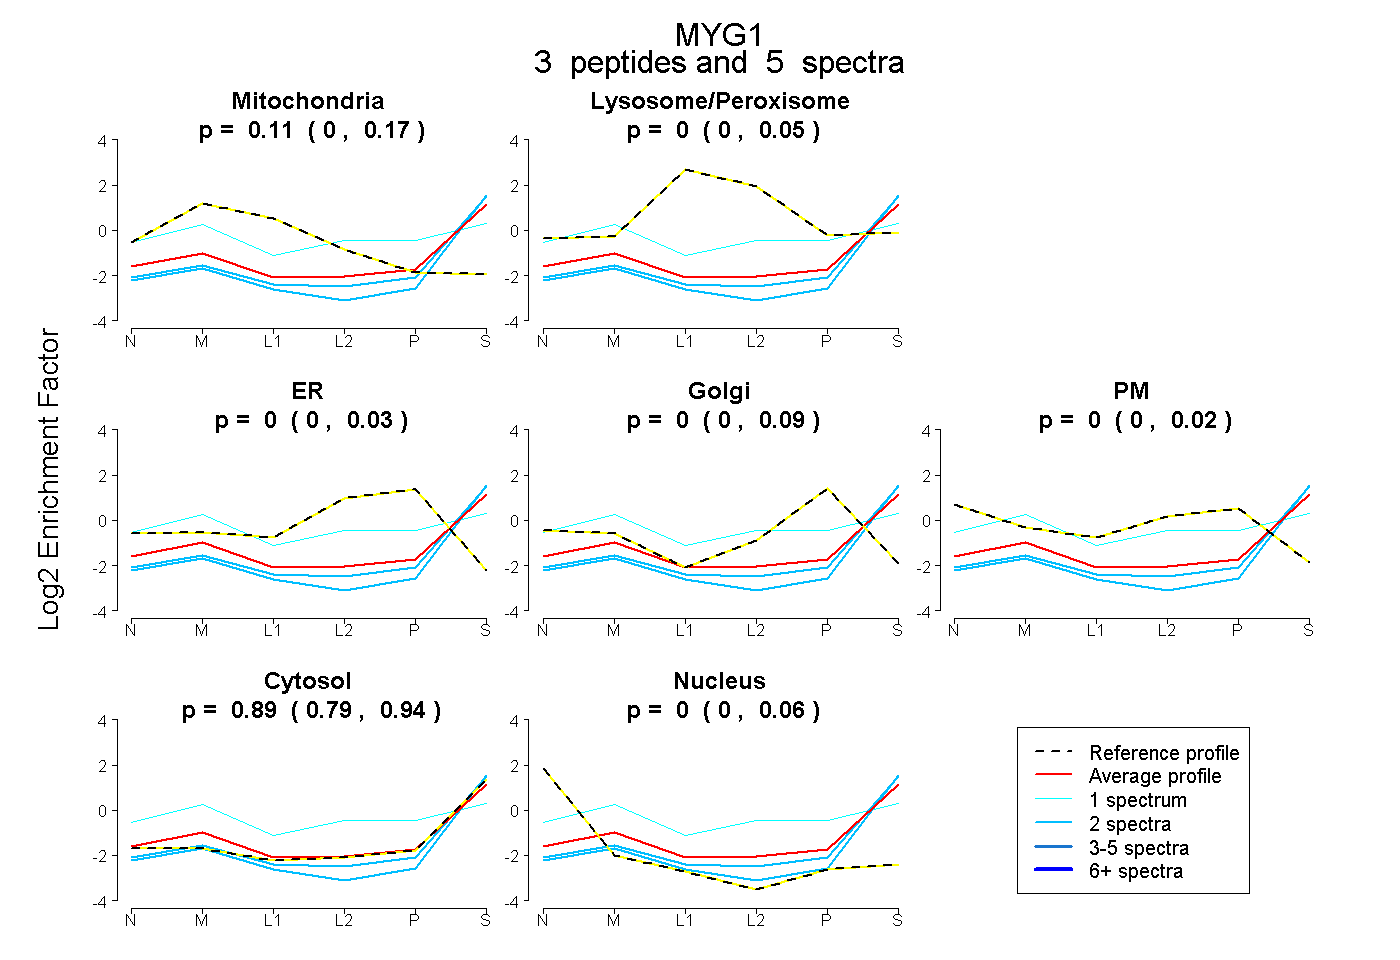
0.000 | 0.166
0.000 | 0.053
0.000 | 0.031
0.000 | 0.088
0.000 | 0.018
0.787 | 0.939
0.000 | 0.062
6peptides
spectra

0.000 | 0.000
1.000 | 1.000