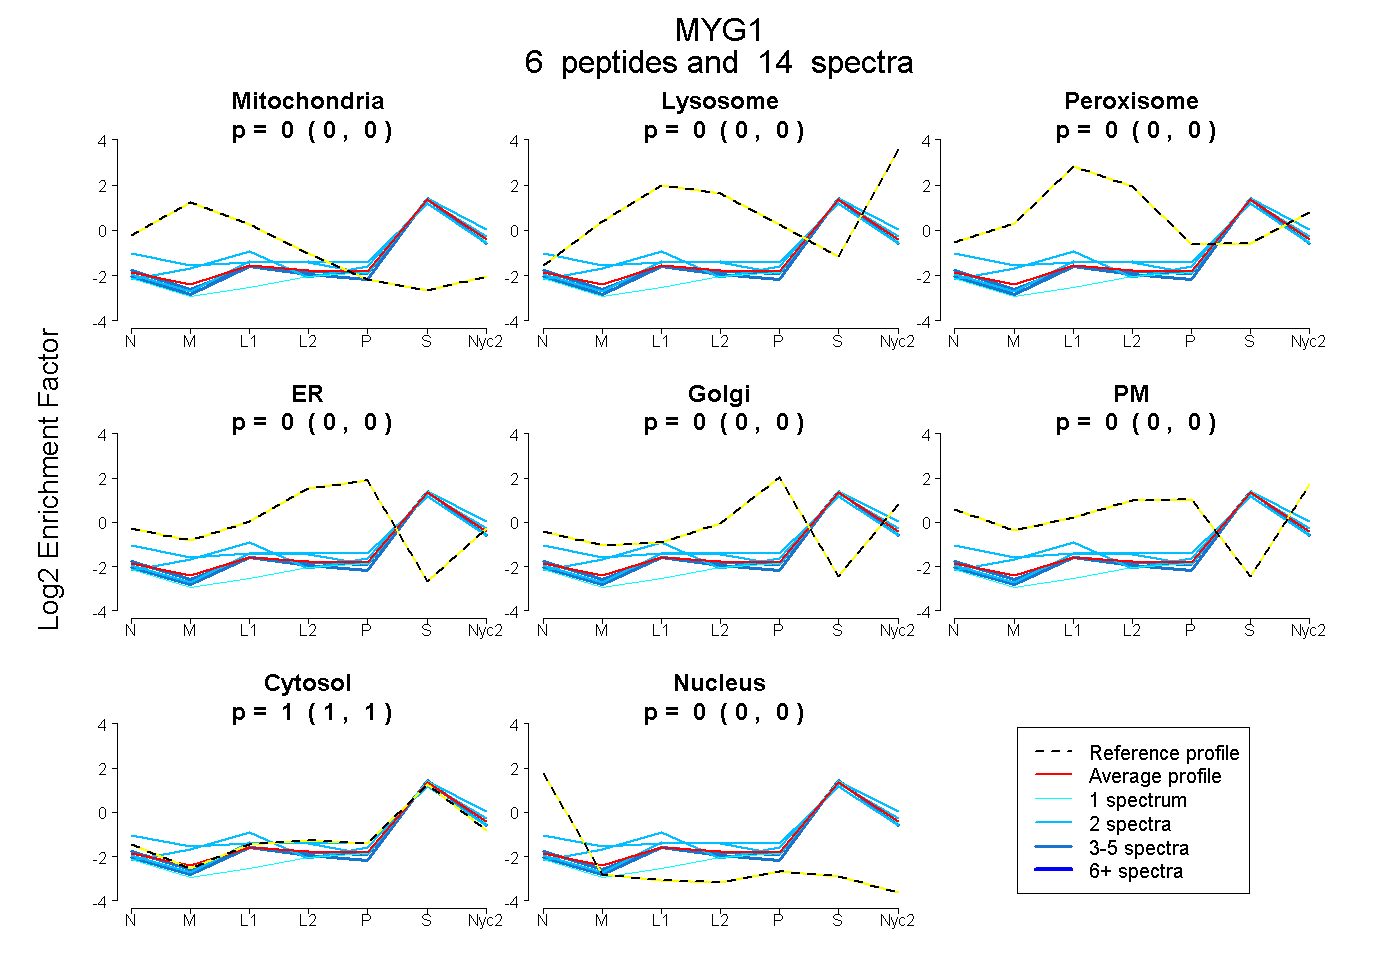
 6
6peptides
spectra
0.000 | 0.000
0.000 | 0.000
0.000 | 0.000
0.000 | 0.000
0.000 | 0.000
0.000 | 0.000
0.999 | 1.000
0.000 | 0.000
| Plot | Mito | Lyso | Perox | ER | Golgi | PM | Cytosol | Nucleus | |||||
| Expt A |
6 peptides |
14 spectra |
|
0.000 0.000 | 0.000 |
0.000 0.000 | 0.000 |
0.000 0.000 | 0.000 |
0.000 0.000 | 0.000 |
0.000 0.000 | 0.000 |
0.000 0.000 | 0.000 |
1.000 0.999 | 1.000 |
0.000 0.000 | 0.000 |
| 2 spectra, GGCPWK | 0.100 | 0.030 | 0.000 | 0.000 | 0.000 | 0.000 | 0.869 | 0.000 | ||
| 2 spectra, EGALNMAR | 0.000 | 0.036 | 0.000 | 0.000 | 0.000 | 0.000 | 0.964 | 0.000 | ||
| 3 spectra, AMDLVQEEFLQR | 0.000 | 0.000 | 0.000 | 0.000 | 0.000 | 0.000 | 1.000 | 0.000 | ||
| 2 spectra, LNFYQHSWLPAR | 0.029 | 0.060 | 0.000 | 0.000 | 0.000 | 0.000 | 0.911 | 0.000 | ||
| 4 spectra, ALVEEALAQR | 0.000 | 0.000 | 0.000 | 0.000 | 0.000 | 0.000 | 1.000 | 0.000 | ||
| 1 spectrum, LPLPEPWR | 0.000 | 0.000 | 0.000 | 0.000 | 0.000 | 0.000 | 0.998 | 0.002 |
| Plot | Mito | Lyso or Perox | ER | Golgi | PM | Cytosol | Nucleus | ||||||
| Expt B |
3 peptides |
5 spectra |
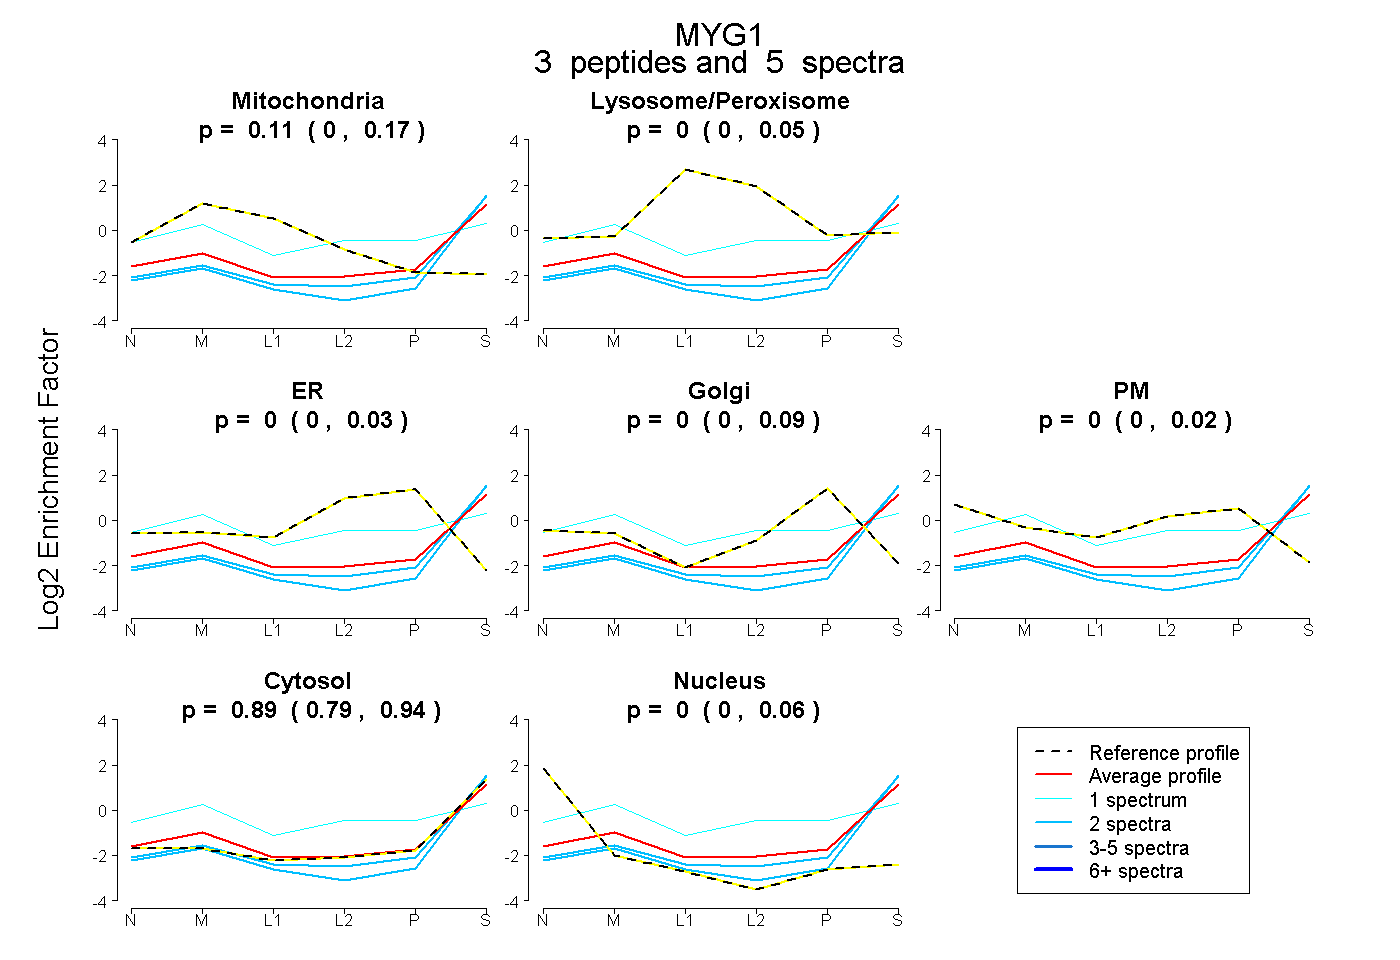 |
0.112 0.000 | 0.166 |
0.000 0.000 | 0.053 |
0.000 0.000 | 0.031 |
0.000 0.000 | 0.088 |
0.000 0.000 | 0.018 |
0.888 0.787 | 0.939 |
0.000 0.000 | 0.062 |
|||
| Plot | Lyso | Other | |||||||||||
| Expt C |
6 peptides |
12 spectra |
 |
0.000 0.000 | 0.000 |
1.000 1.000 | 1.000 |