 10
10peptides
spectra
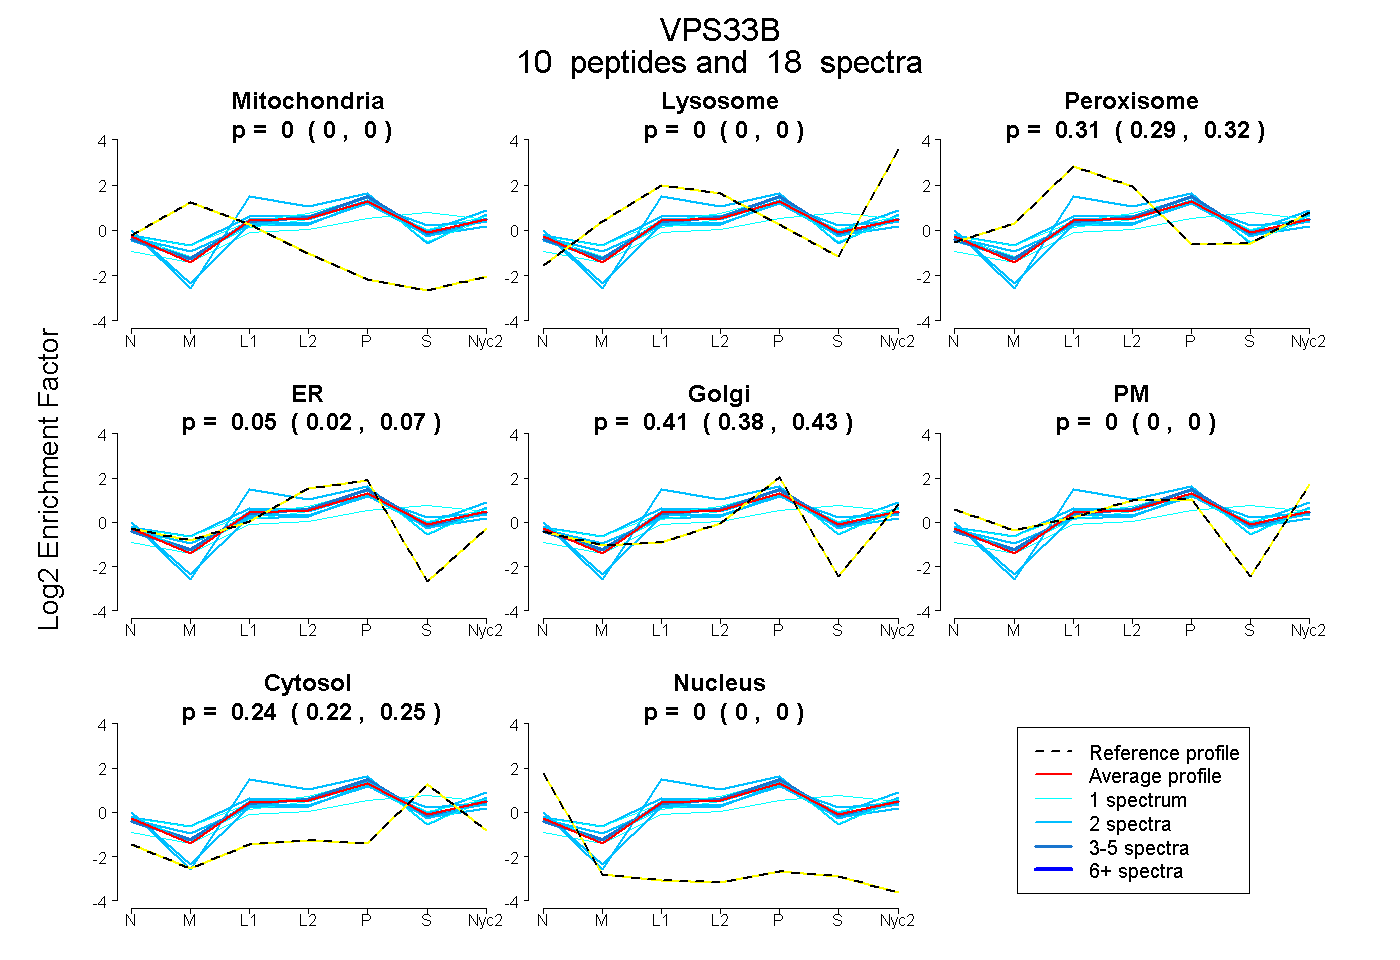
0.000 | 0.000
0.000 | 0.000
0.293 | 0.324
0.020 | 0.069
0.381 | 0.427
0.000 | 0.000
0.225 | 0.247
0.000 | 0.000
8peptides
spectra
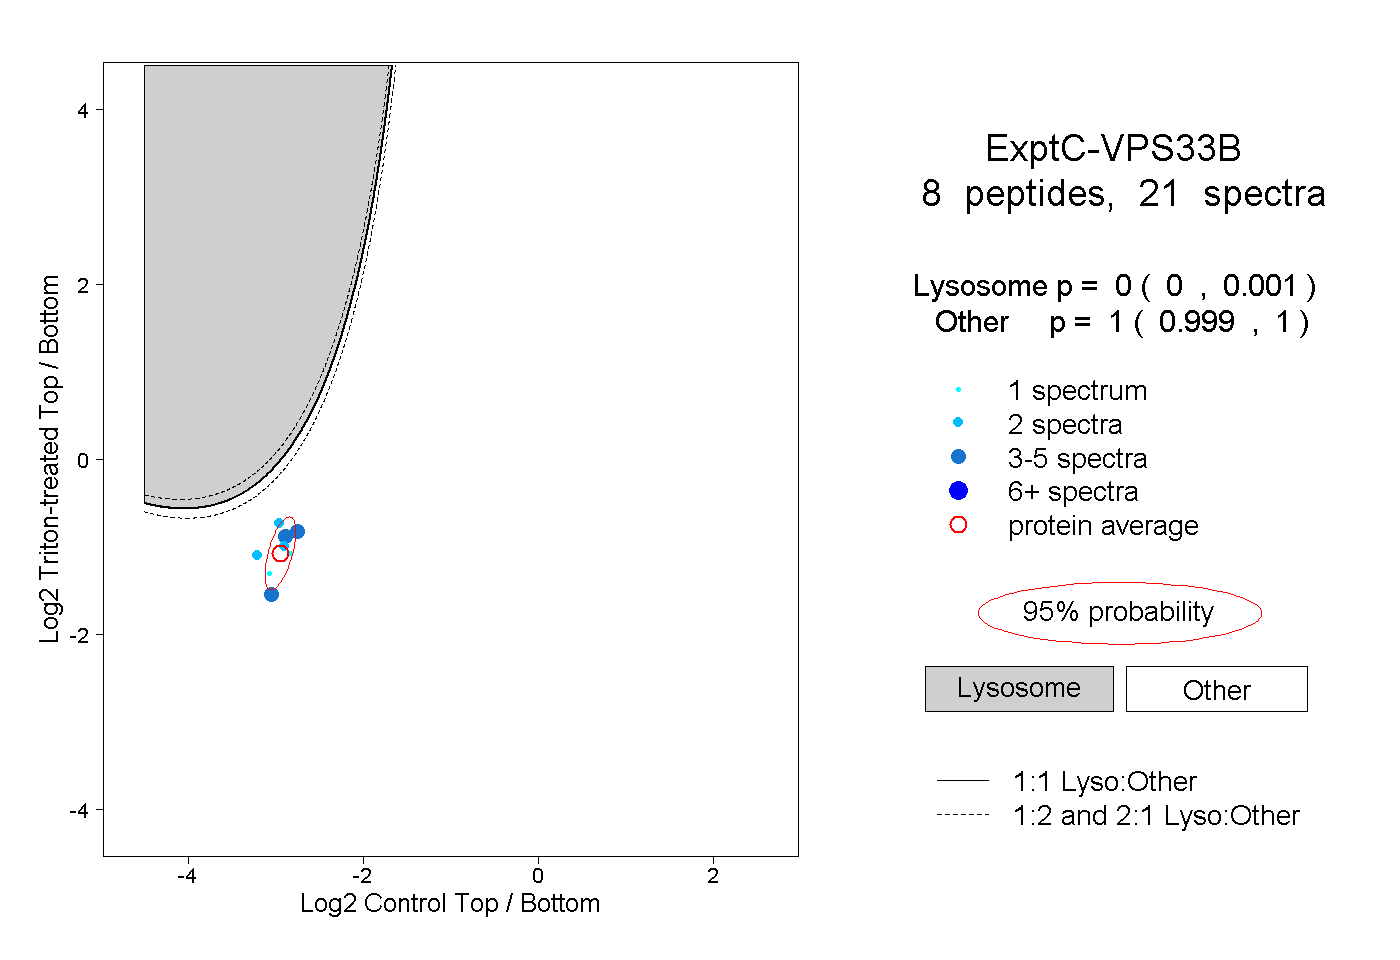
0.000 | 0.001
0.999 | 1.000
1peptide
spectra
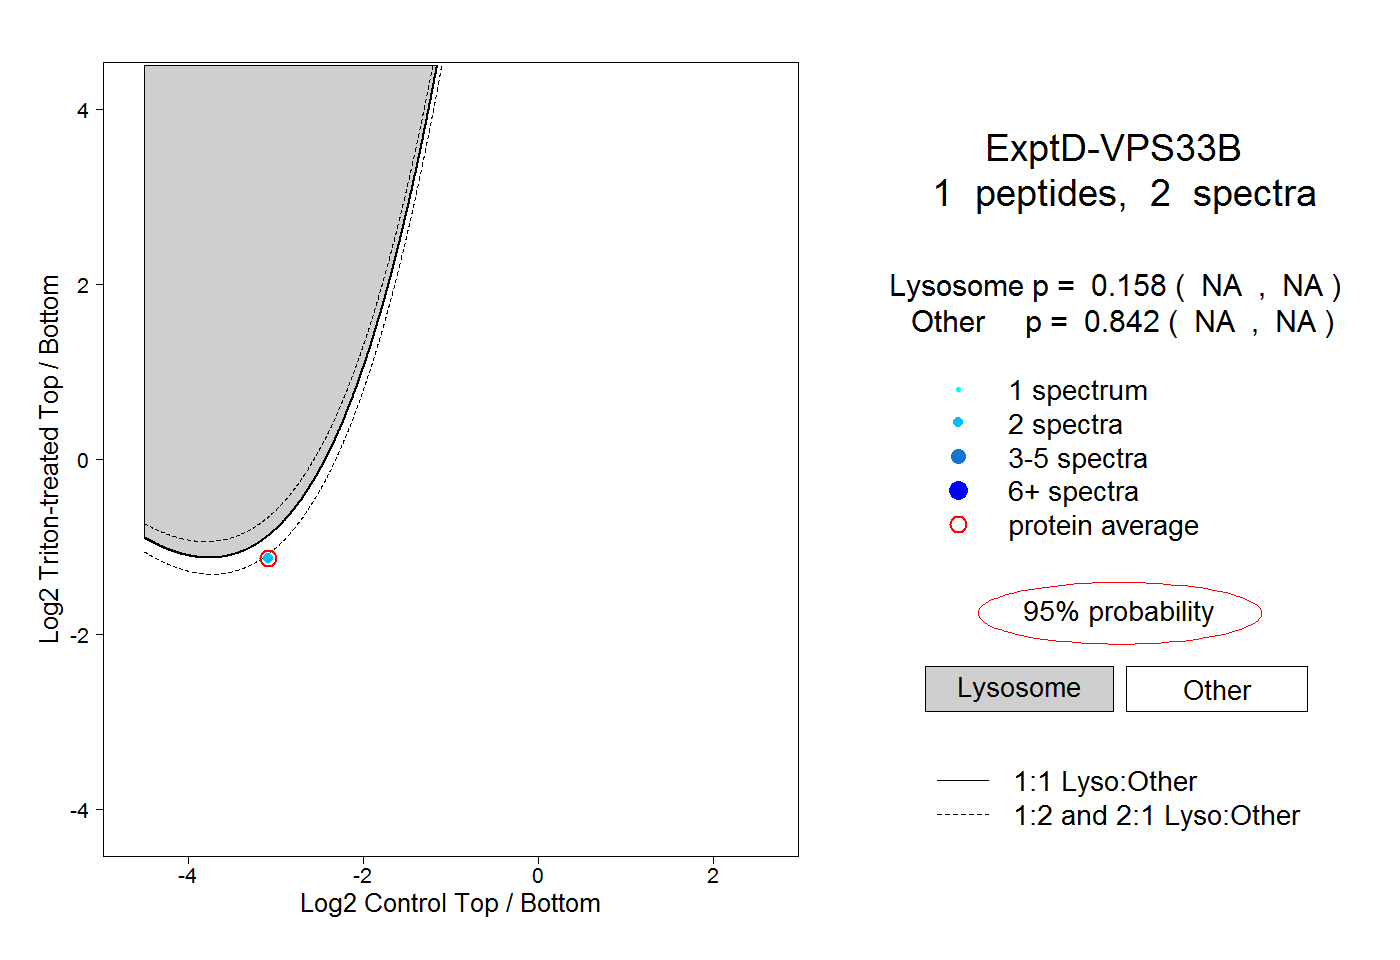
NA | NA
NA | NA