 10
10peptides
spectra
0.000 | 0.000
0.000 | 0.000
0.293 | 0.324
0.020 | 0.069
0.381 | 0.427
0.000 | 0.000
0.225 | 0.247
0.000 | 0.000
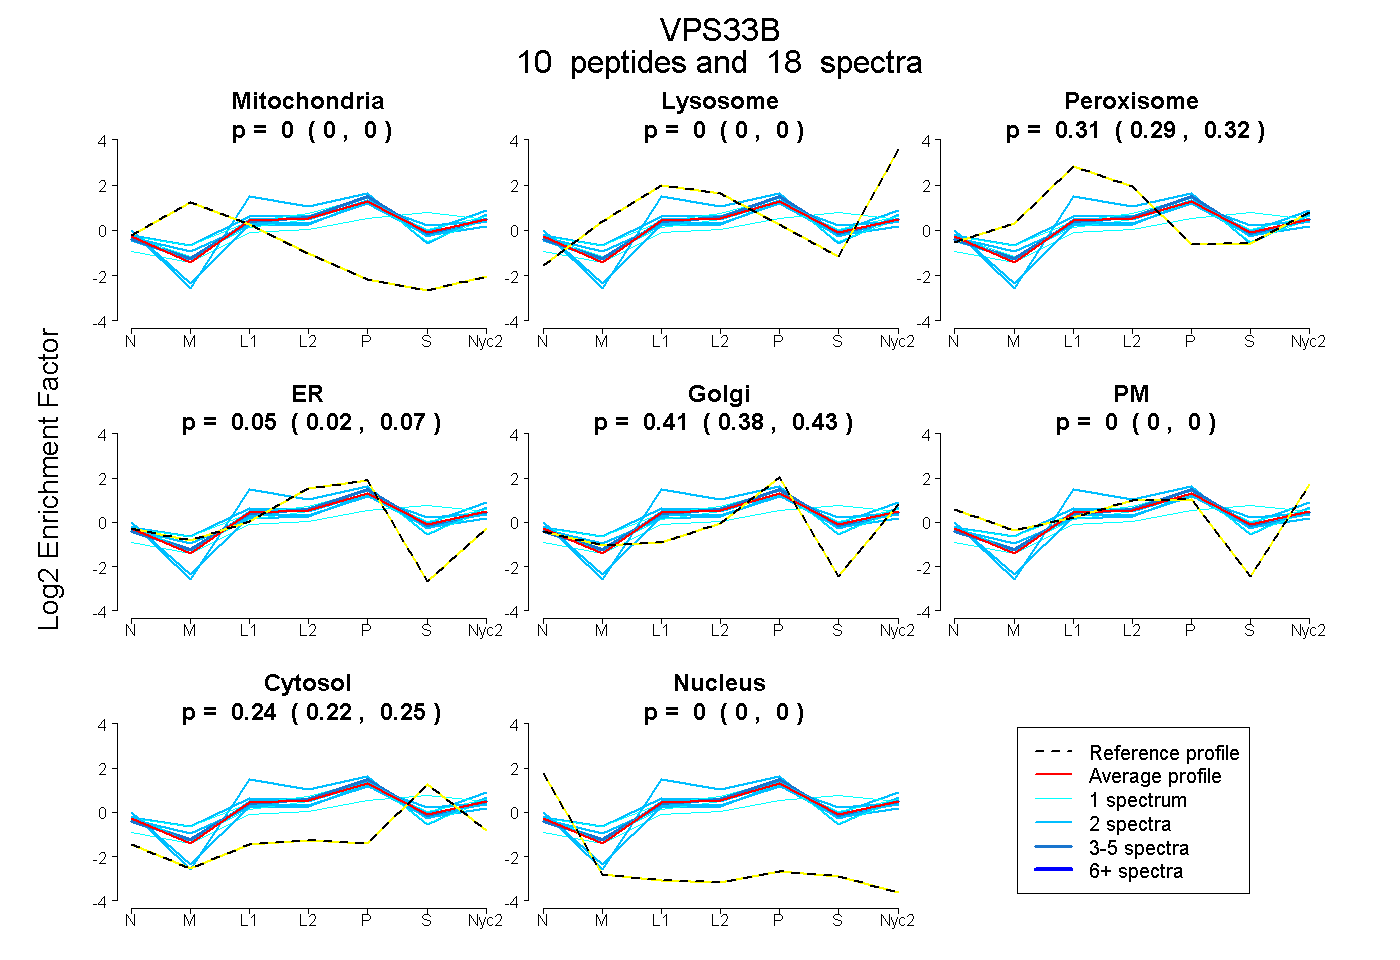
| Plot | Mito | Lyso | Perox | ER | Golgi | PM | Cytosol | Nucleus | |||||
| Expt A |
10 peptides |
18 spectra |
|
0.000 0.000 | 0.000 |
0.000 0.000 | 0.000 |
0.311 0.293 | 0.324 |
0.047 0.020 | 0.069 |
0.406 0.381 | 0.427 |
0.000 0.000 | 0.000 |
0.236 0.225 | 0.247 |
0.000 0.000 | 0.000 |
| 2 spectra, SWQGLDEVVR | 0.000 | 0.000 | 0.305 | 0.000 | 0.400 | 0.000 | 0.295 | 0.000 | ||
| 1 spectrum, NFVSQELK | 0.000 | 0.023 | 0.280 | 0.000 | 0.446 | 0.000 | 0.251 | 0.000 | ||
| 2 spectra, VLLNAEDK | 0.000 | 0.000 | 0.303 | 0.084 | 0.370 | 0.000 | 0.243 | 0.000 | ||
| 2 spectra, DYFLEGDQR | 0.000 | 0.116 | 0.210 | 0.000 | 0.433 | 0.000 | 0.241 | 0.000 | ||
| 2 spectra, IILSPQK | 0.000 | 0.024 | 0.308 | 0.325 | 0.184 | 0.000 | 0.160 | 0.000 | ||
| 2 spectra, RPEIGHIFLLDR | 0.000 | 0.041 | 0.053 | 0.317 | 0.102 | 0.156 | 0.330 | 0.000 | ||
| 2 spectra, ESTSYIEEHIDR | 0.000 | 0.000 | 0.363 | 0.135 | 0.308 | 0.000 | 0.193 | 0.000 | ||
| 1 spectrum, IANVSILK | 0.000 | 0.175 | 0.122 | 0.017 | 0.182 | 0.000 | 0.504 | 0.000 | ||
| 1 spectrum, QVSPIESLR | 0.000 | 0.000 | 0.340 | 0.081 | 0.456 | 0.000 | 0.123 | 0.000 | ||
| 3 spectra, VDGEYDLK | 0.000 | 0.017 | 0.278 | 0.106 | 0.385 | 0.000 | 0.214 | 0.000 |
| Plot | Lyso | Other | |||||||||||
| Expt C |
8 peptides |
21 spectra |
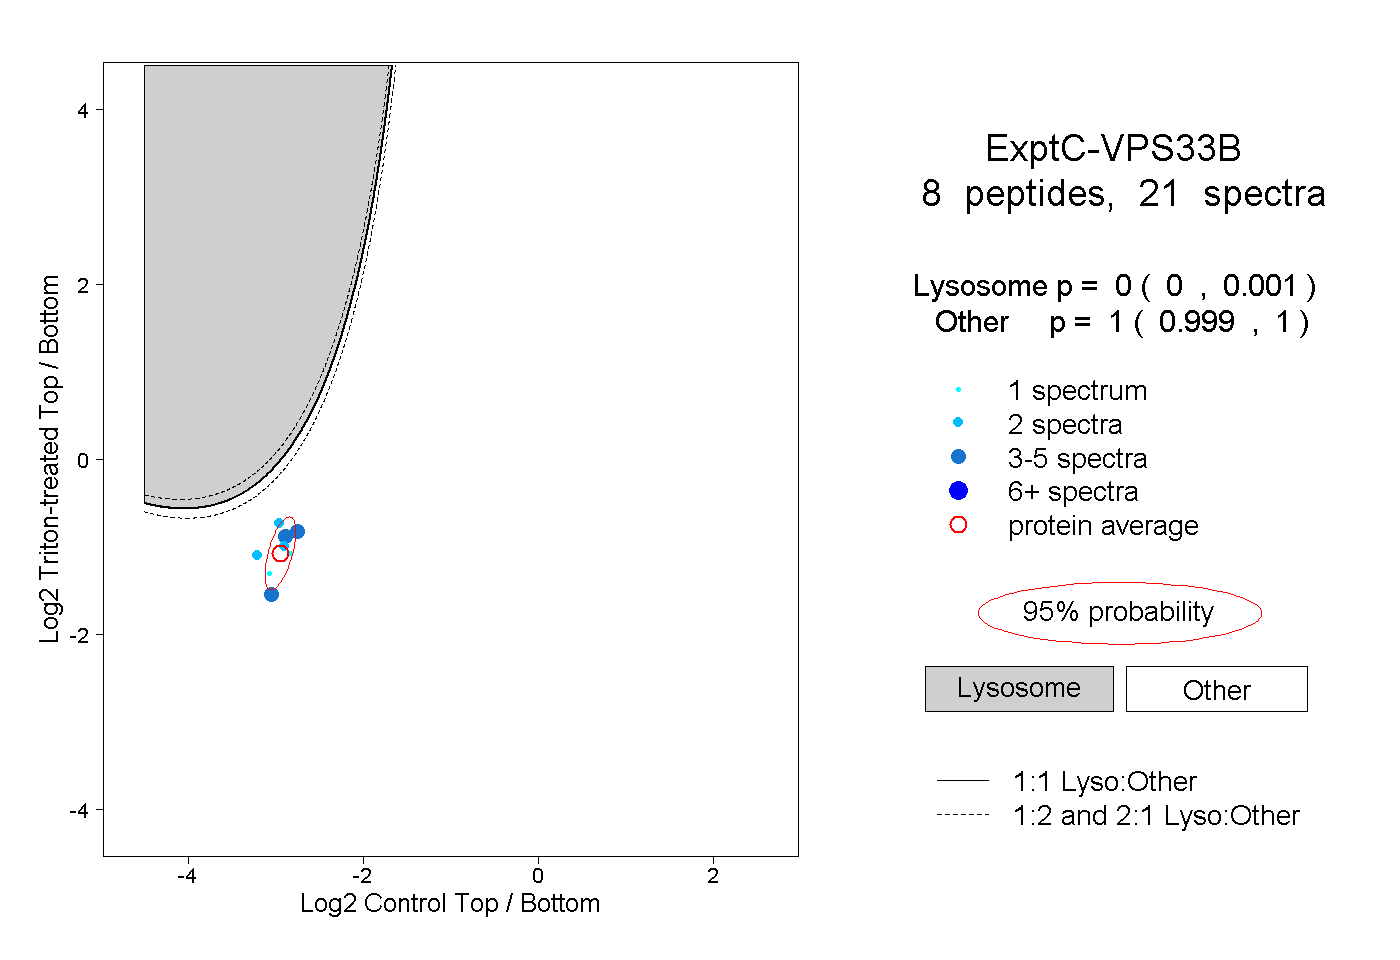 |
0.000 0.000 | 0.001 |
1.000 0.999 | 1.000 |
||||||||
| Plot | Lyso | Other | |||||||||||
| Expt D |
1 peptide |
2 spectra |
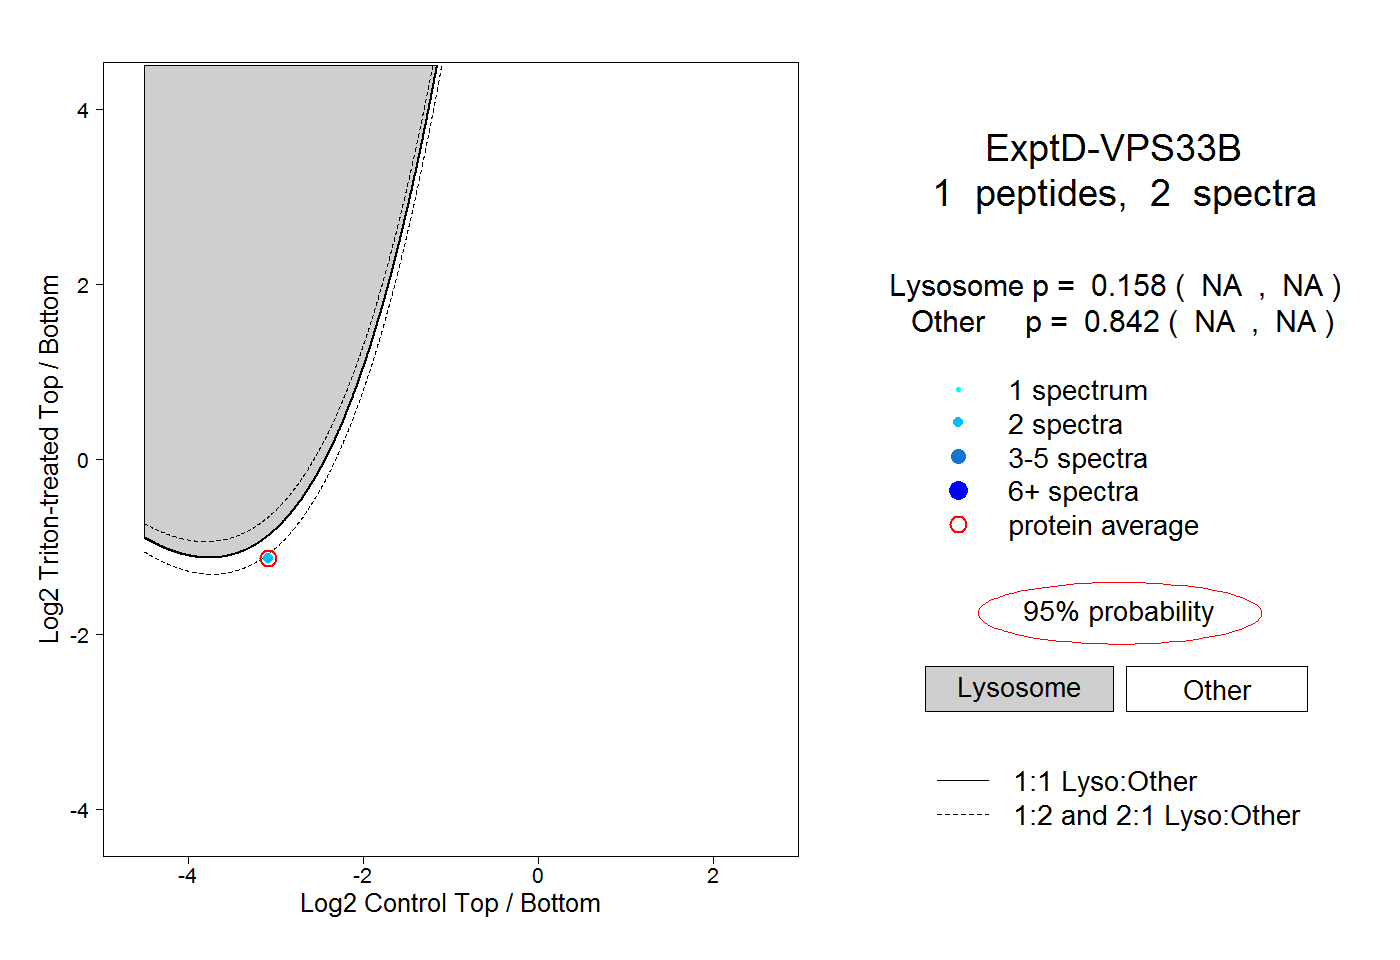 |
0.158 NA | NA |
0.842 NA | NA |