 15
15peptides
spectra
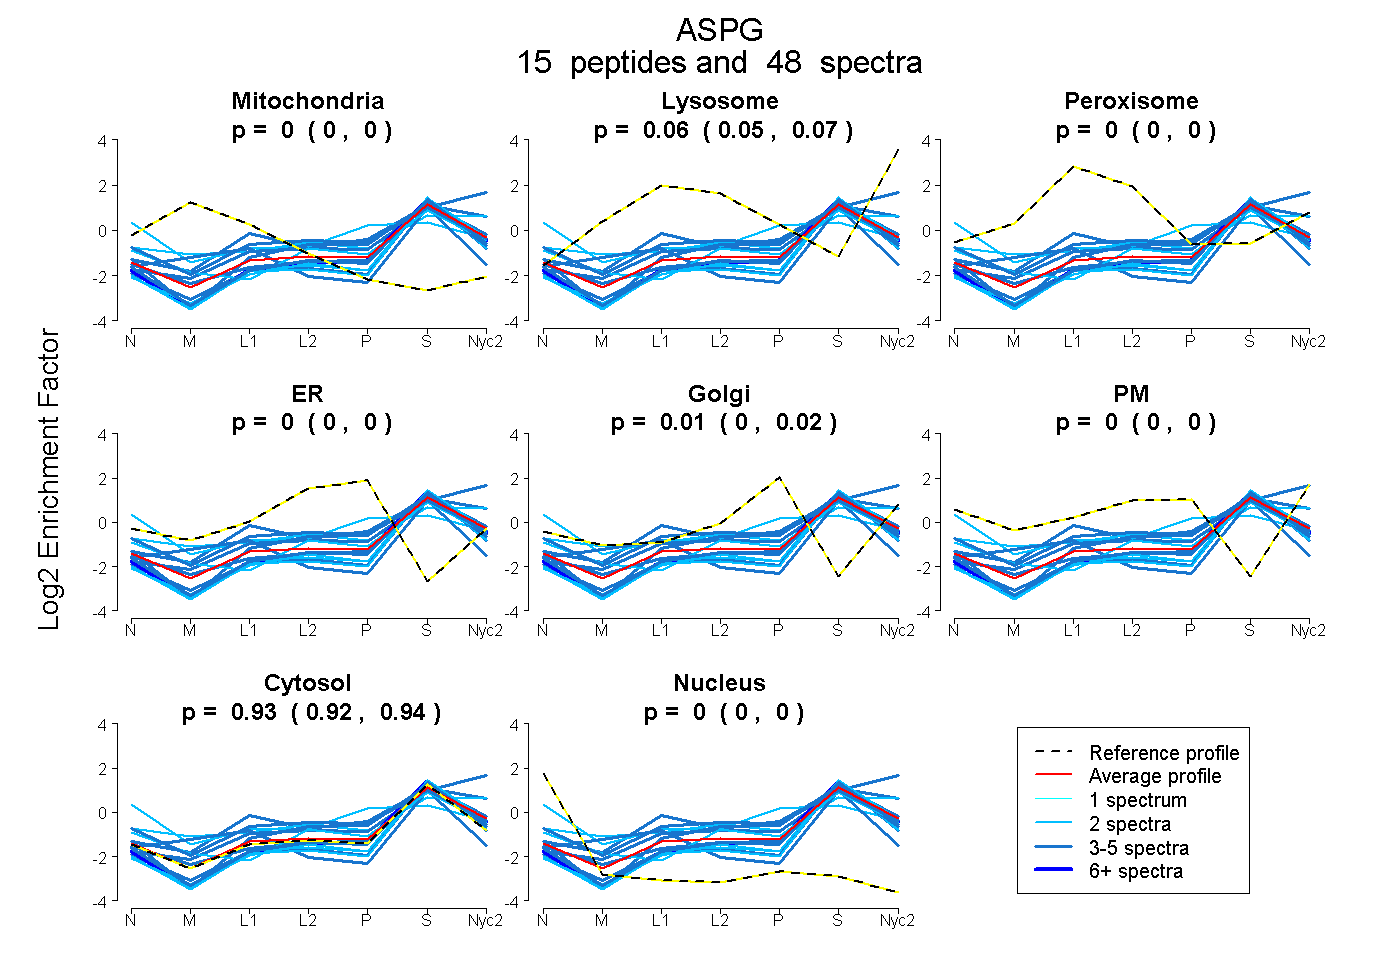
0.000 | 0.000
0.050 | 0.067
0.000 | 0.000
0.000 | 0.000
0.000 | 0.019
0.000 | 0.000
0.923 | 0.937
0.000 | 0.000
7peptides
spectra
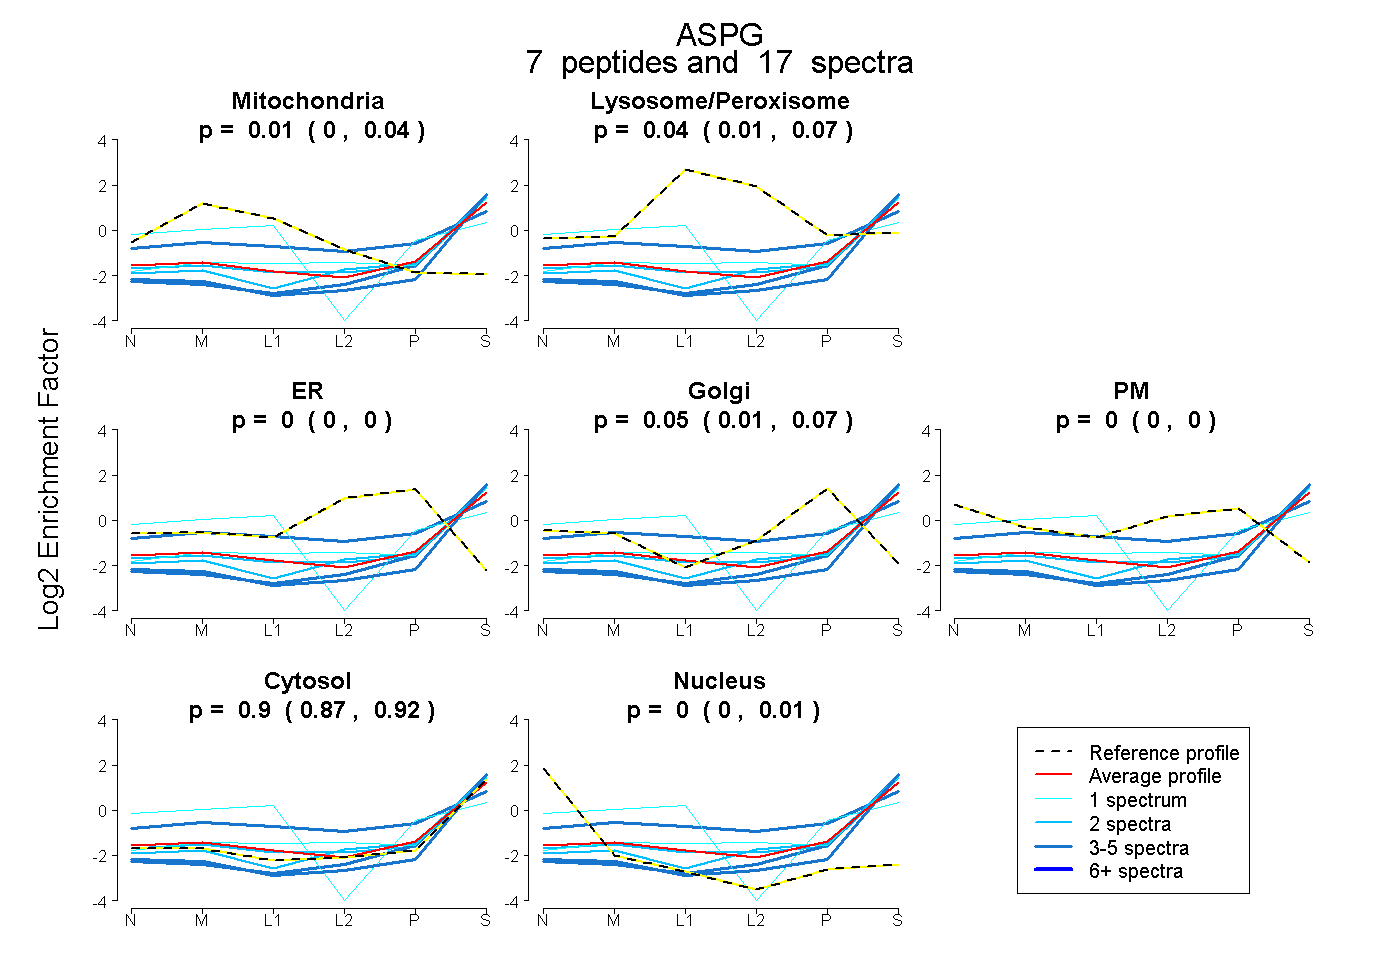
0.000 | 0.045
0.007 | 0.071
0.000 | 0.000
0.012 | 0.071
0.000 | 0.000
0.871 | 0.917
0.000 | 0.007
12peptides
spectra
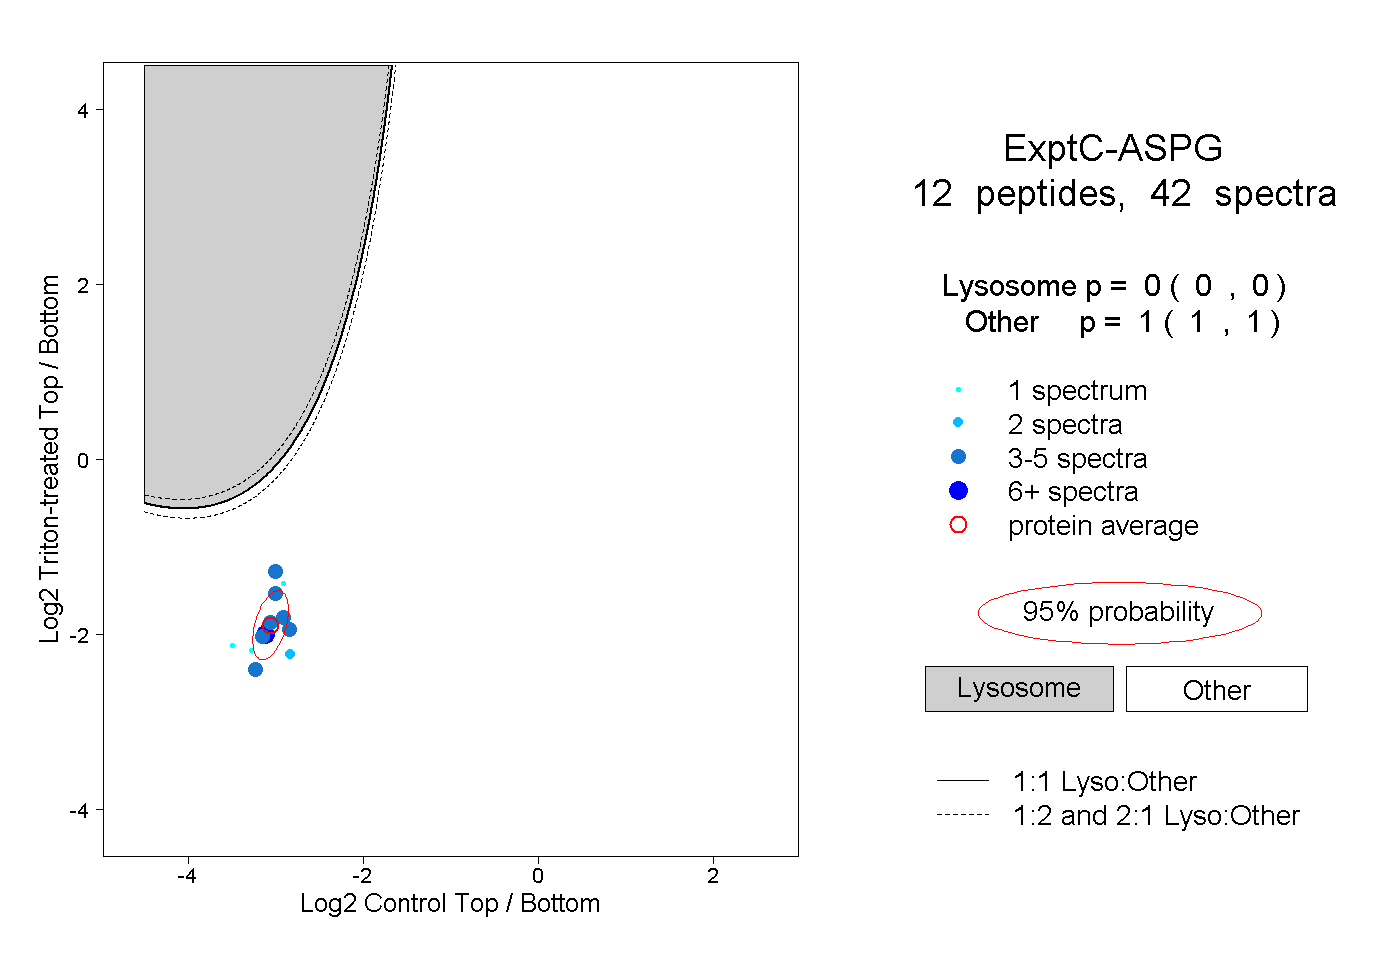
0.000 | 0.000
1.000 | 1.000
3peptides
spectra
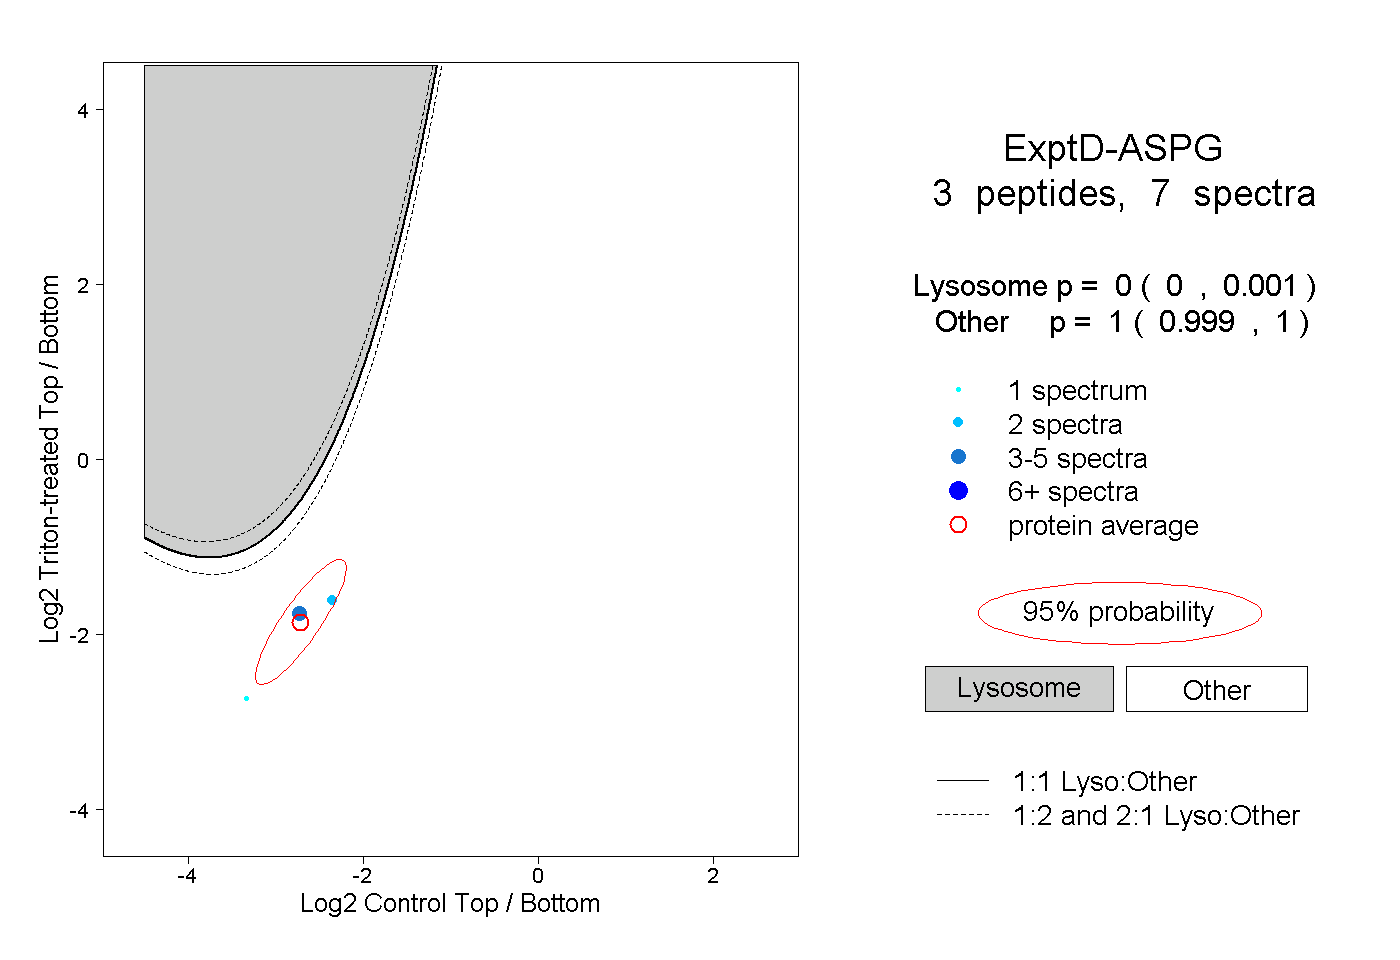
0.000 | 0.001
0.999 | 1.000