 15
15peptides
spectra
0.000 | 0.000
0.050 | 0.067
0.000 | 0.000
0.000 | 0.000
0.000 | 0.019
0.000 | 0.000
0.923 | 0.937
0.000 | 0.000
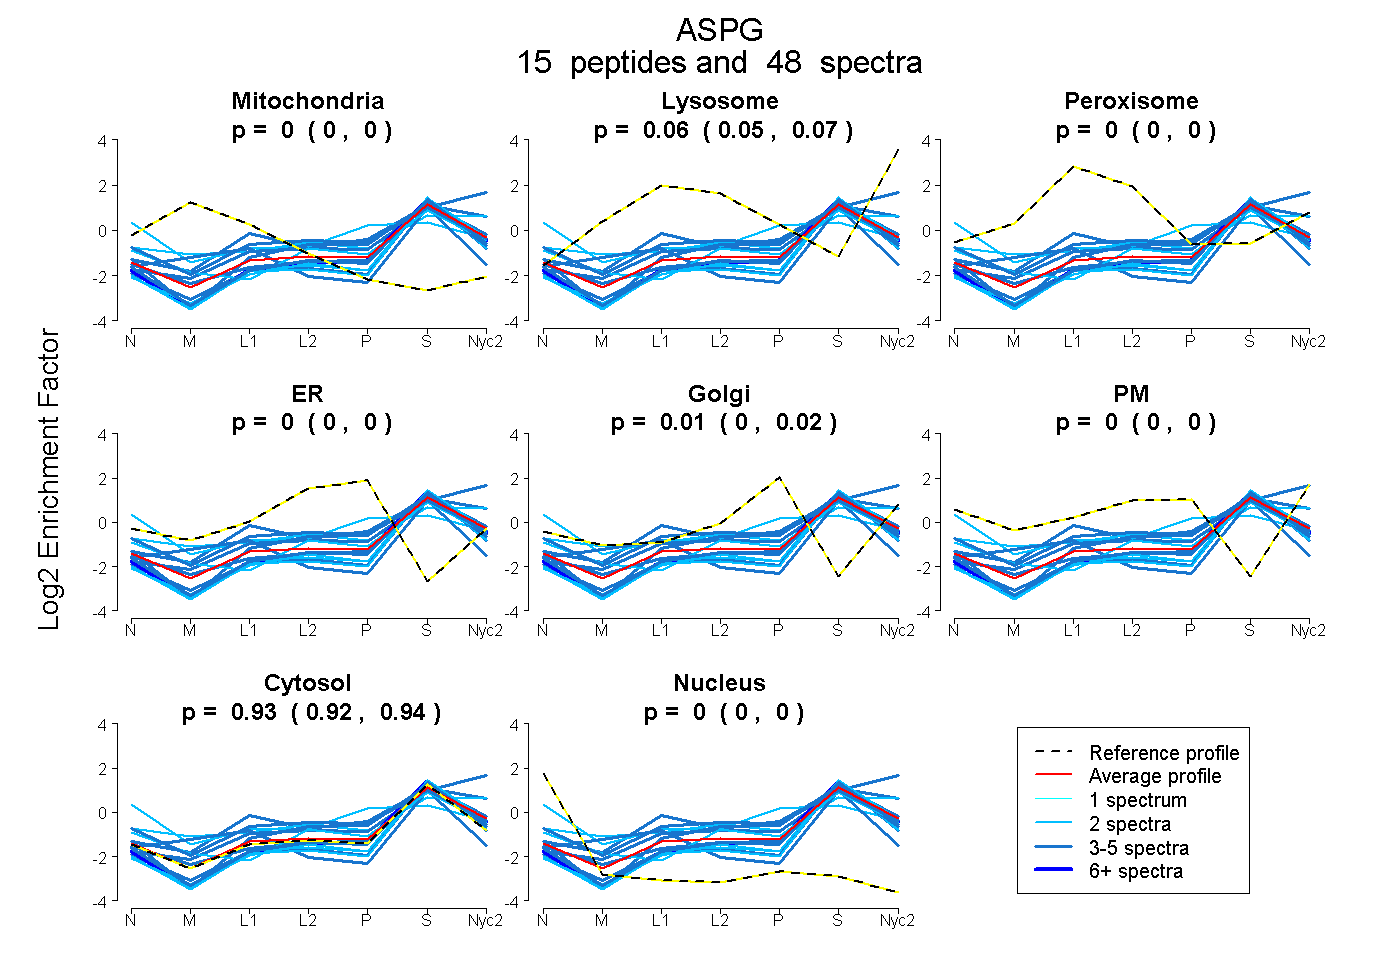
| Plot | Mito | Lyso | Perox | ER | Golgi | PM | Cytosol | Nucleus | |||||
| Expt A |
15 peptides |
48 spectra |
|
0.000 0.000 | 0.000 |
0.060 0.050 | 0.067 |
0.000 0.000 | 0.000 |
0.000 0.000 | 0.000 |
0.010 0.000 | 0.019 |
0.000 0.000 | 0.000 |
0.930 0.923 | 0.937 |
0.000 0.000 | 0.000 |
| 2 spectra, SHLVVHSNMEPDVGLLR | 0.000 | 0.000 | 0.000 | 0.000 | 0.052 | 0.082 | 0.838 | 0.028 | ||
| 6 spectra, GLAAVLR | 0.000 | 0.000 | 0.000 | 0.000 | 0.000 | 0.000 | 1.000 | 0.000 | ||
| 5 spectra, TLHMLHDEEYAR | 0.000 | 0.000 | 0.136 | 0.048 | 0.000 | 0.082 | 0.735 | 0.000 | ||
| 2 spectra, AHSLPEDTLVLPPASSDQR | 0.009 | 0.186 | 0.000 | 0.000 | 0.000 | 0.145 | 0.660 | 0.000 | ||
| 2 spectra, LYPGIPASLVR | 0.000 | 0.000 | 0.000 | 0.000 | 0.000 | 0.000 | 1.000 | 0.000 | ||
| 2 spectra, TFLQPPLK | 0.000 | 0.000 | 0.000 | 0.000 | 0.000 | 0.000 | 1.000 | 0.000 | ||
| 3 spectra, LLAIYTGGTIGMR | 0.000 | 0.034 | 0.000 | 0.011 | 0.069 | 0.000 | 0.887 | 0.000 | ||
| 3 spectra, DYSGQTPLHVAAR | 0.000 | 0.295 | 0.000 | 0.000 | 0.000 | 0.000 | 0.705 | 0.000 | ||
| 3 spectra, AAGAHLSPQELEDVGTELCR | 0.000 | 0.291 | 0.000 | 0.000 | 0.000 | 0.000 | 0.709 | 0.000 | ||
| 4 spectra, SEGGVLVPGR | 0.000 | 0.000 | 0.000 | 0.000 | 0.020 | 0.000 | 0.980 | 0.000 | ||
| 2 spectra, ADSEGLR | 0.000 | 0.000 | 0.000 | 0.022 | 0.023 | 0.351 | 0.555 | 0.049 | ||
| 5 spectra, VSAQPQPH | 0.000 | 0.000 | 0.000 | 0.000 | 0.000 | 0.000 | 1.000 | 0.000 | ||
| 3 spectra, GVVMETFGSGNGPTKPDLLQELR | 0.229 | 0.000 | 0.000 | 0.000 | 0.000 | 0.000 | 0.771 | 0.000 | ||
| 4 spectra, ATGPEQR | 0.000 | 0.000 | 0.000 | 0.000 | 0.000 | 0.000 | 0.999 | 0.001 | ||
| 2 spectra, LSYVLGQPGLSLSDR | 0.000 | 0.000 | 0.000 | 0.000 | 0.000 | 0.000 | 1.000 | 0.000 |
| Plot | Mito | Lyso or Perox | ER | Golgi | PM | Cytosol | Nucleus | ||||||
| Expt B |
7 peptides |
17 spectra |
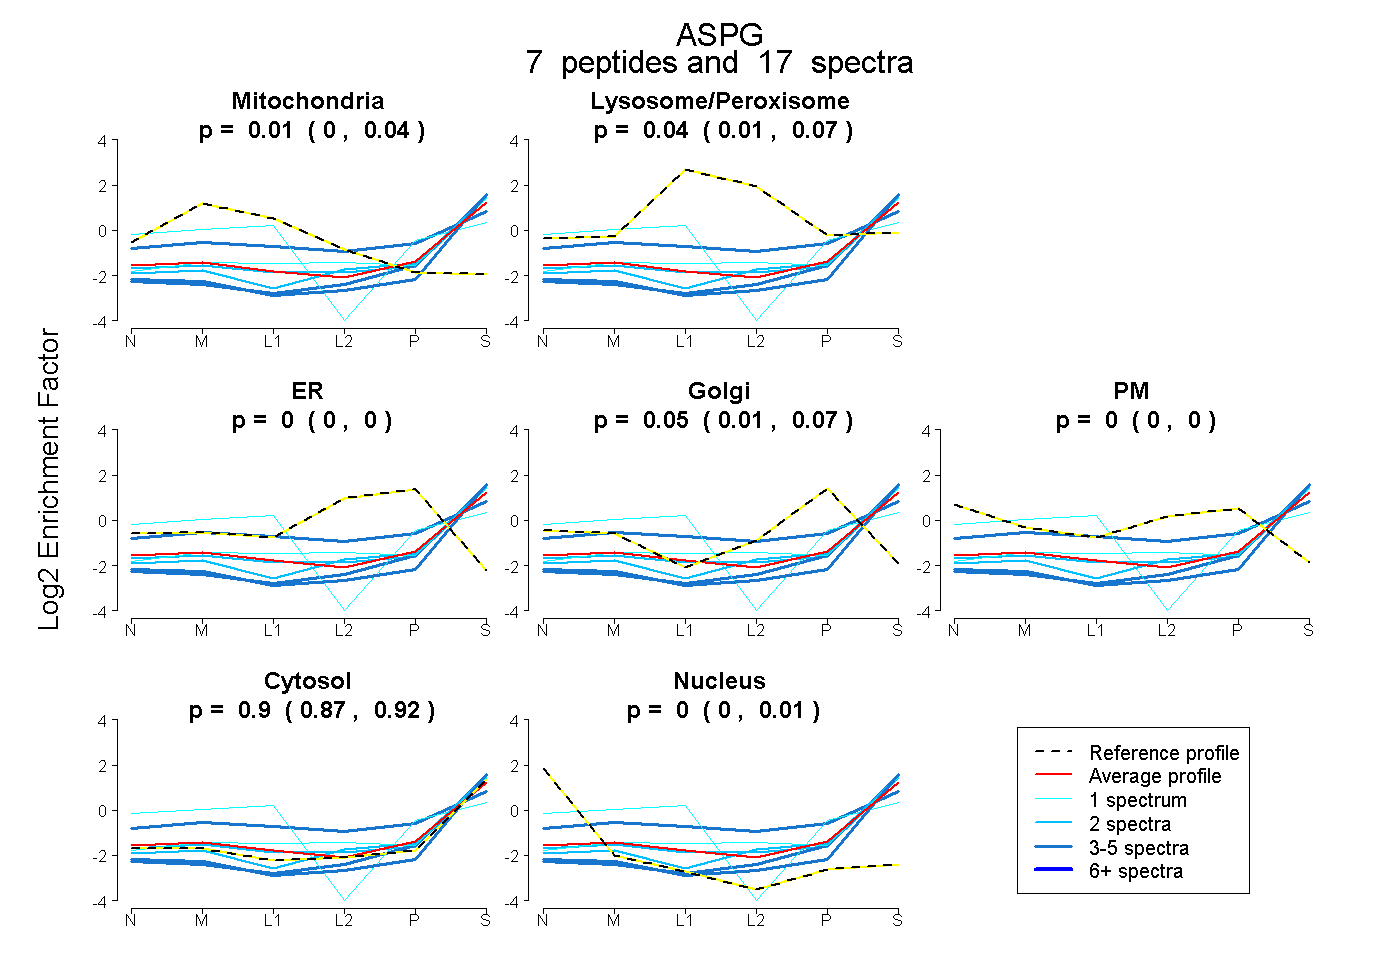 |
0.013 0.000 | 0.045 |
0.044 0.007 | 0.071 |
0.000 0.000 | 0.000 |
0.046 0.012 | 0.071 |
0.000 0.000 | 0.000 |
0.897 0.871 | 0.917 |
0.000 0.000 | 0.007 |
|||
| Plot | Lyso | Other | |||||||||||
| Expt C |
12 peptides |
42 spectra |
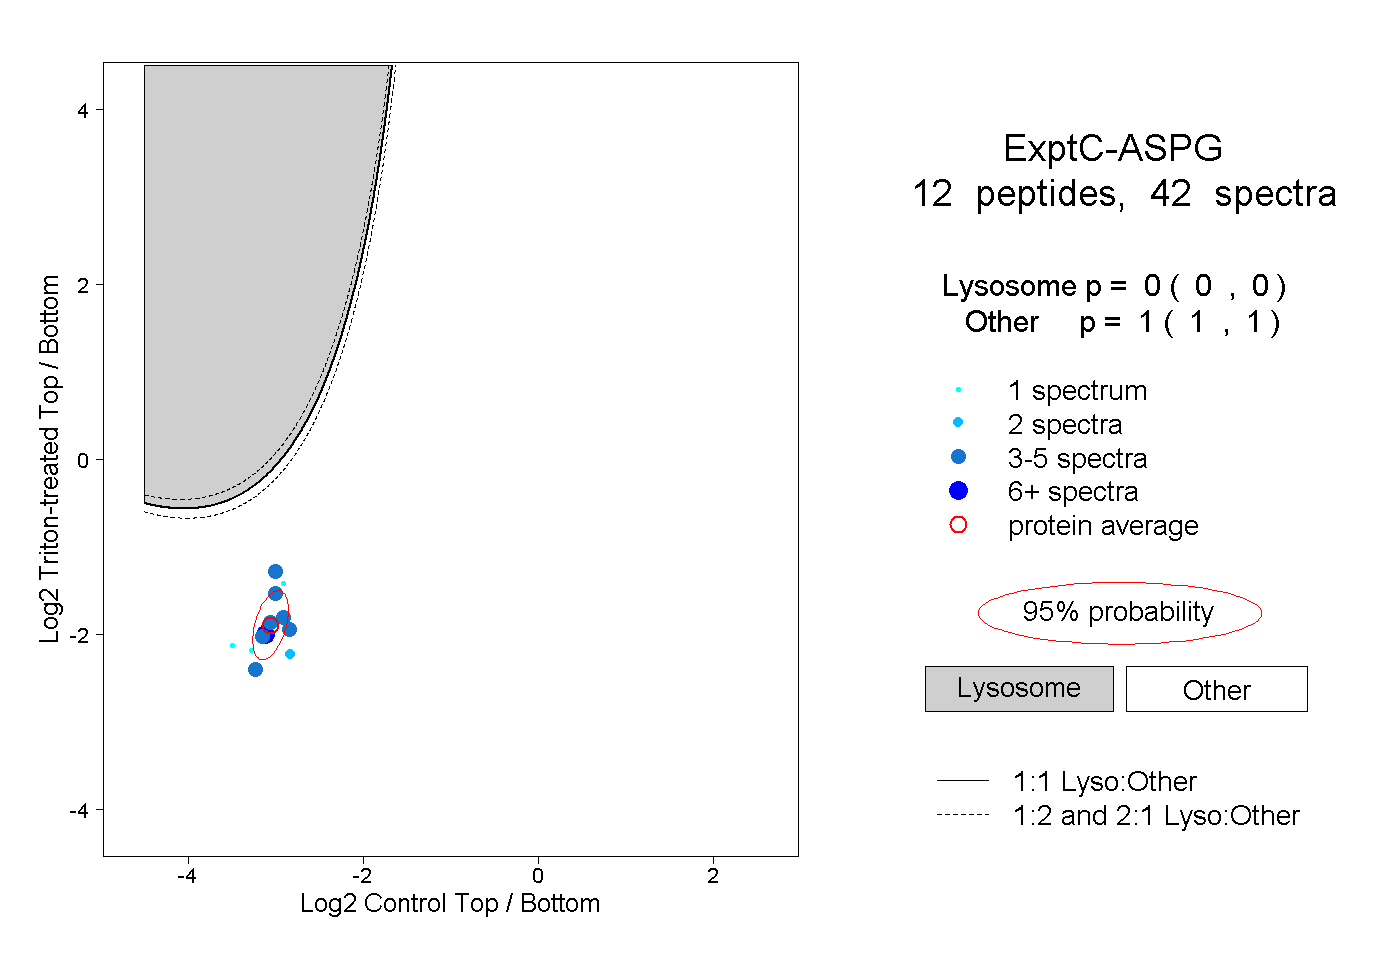 |
0.000 0.000 | 0.000 |
1.000 1.000 | 1.000 |
||||||||
| Plot | Lyso | Other | |||||||||||
| Expt D |
3 peptides |
7 spectra |
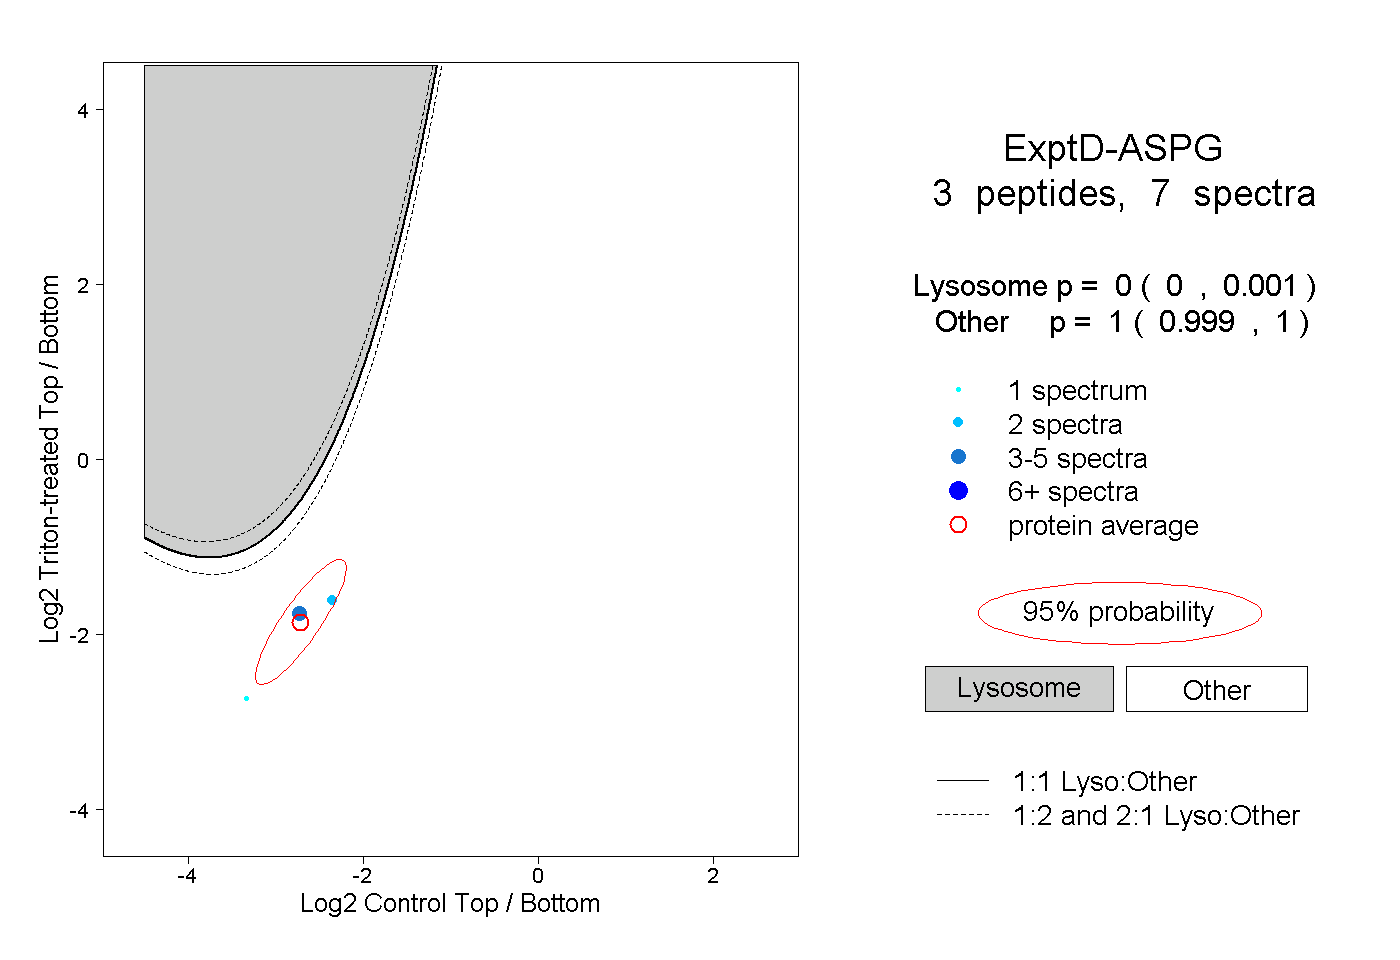 |
0.000 0.000 | 0.001 |
1.000 0.999 | 1.000 |