 10
10peptides
spectra
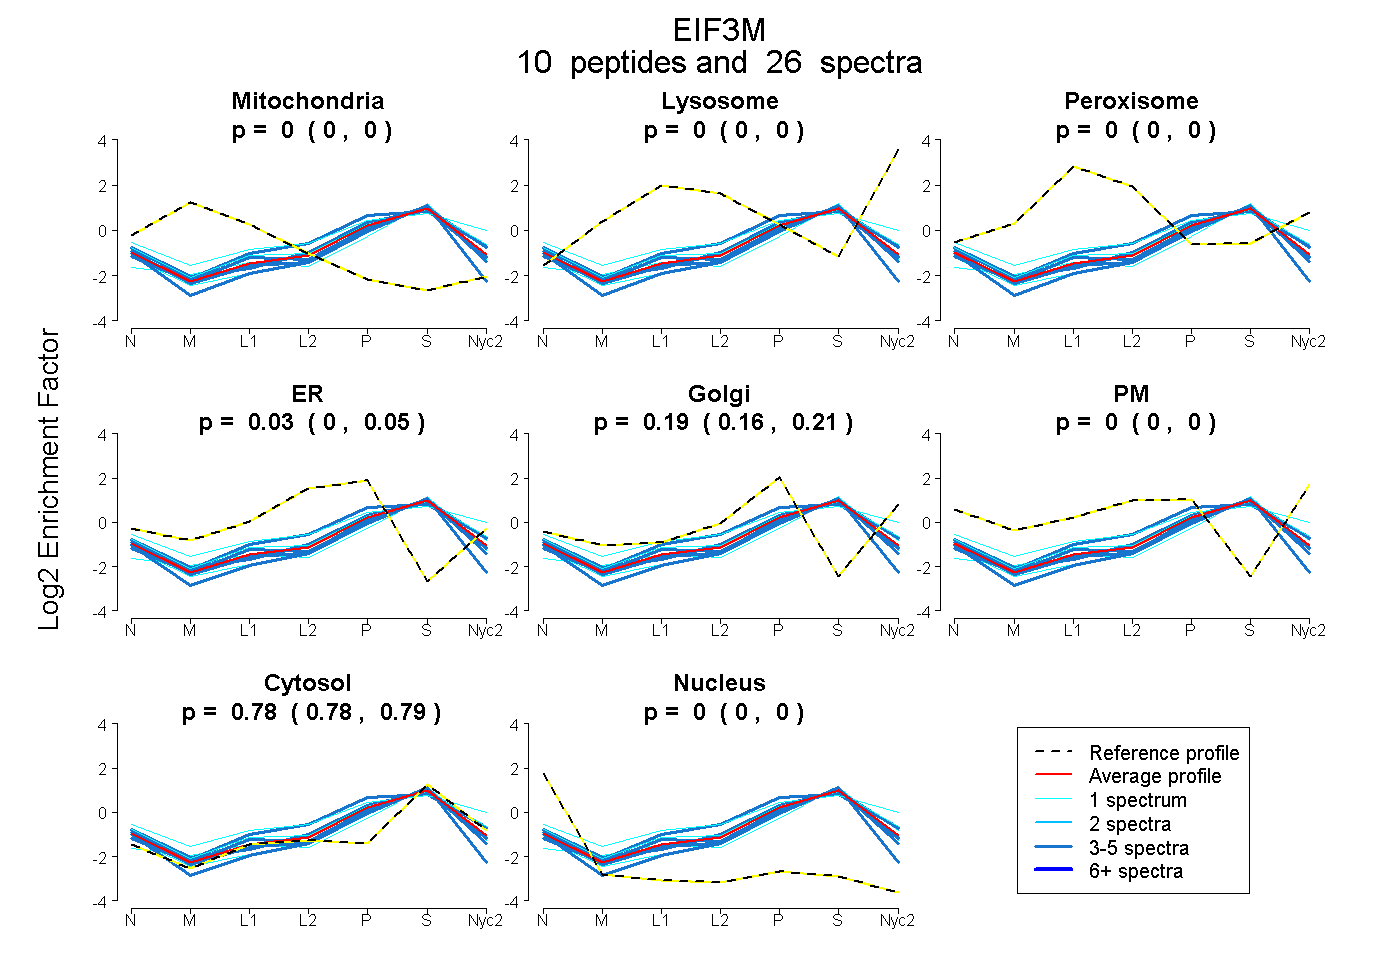
0.000 | 0.000
0.000 | 0.000
0.000 | 0.000
0.001 | 0.046
0.164 | 0.214
0.000 | 0.000
0.777 | 0.788
0.000 | 0.000
5peptides
spectra

0.000 | 0.000
0.078 | 0.147
0.186 | 0.326
0.000 | 0.116
0.000 | 0.000
0.532 | 0.583
0.000 | 0.000
9peptides
spectra
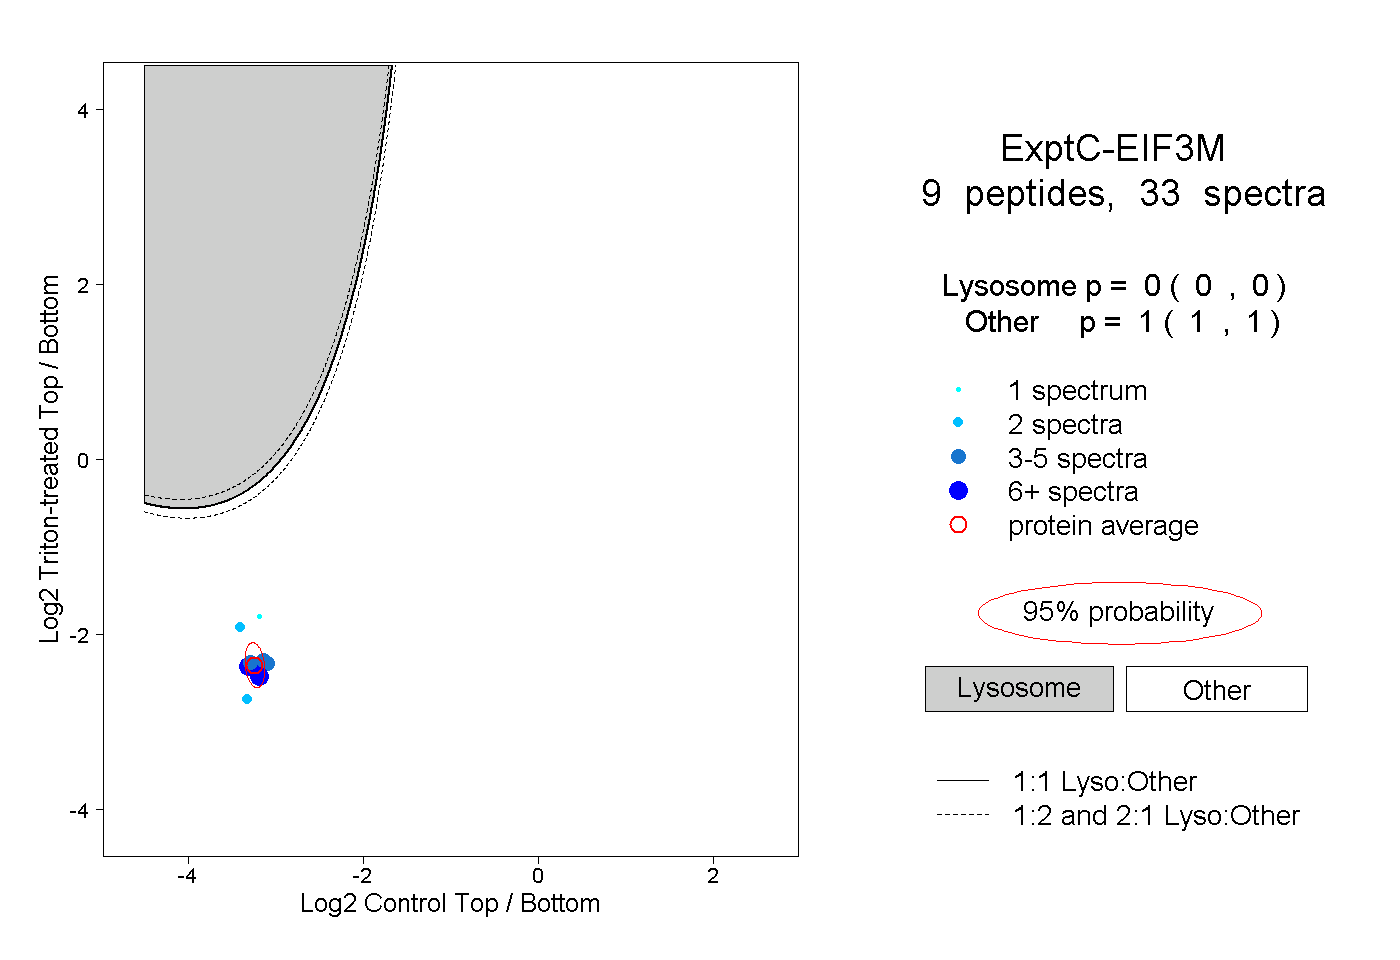
0.000 | 0.000
1.000 | 1.000
2peptides
spectra
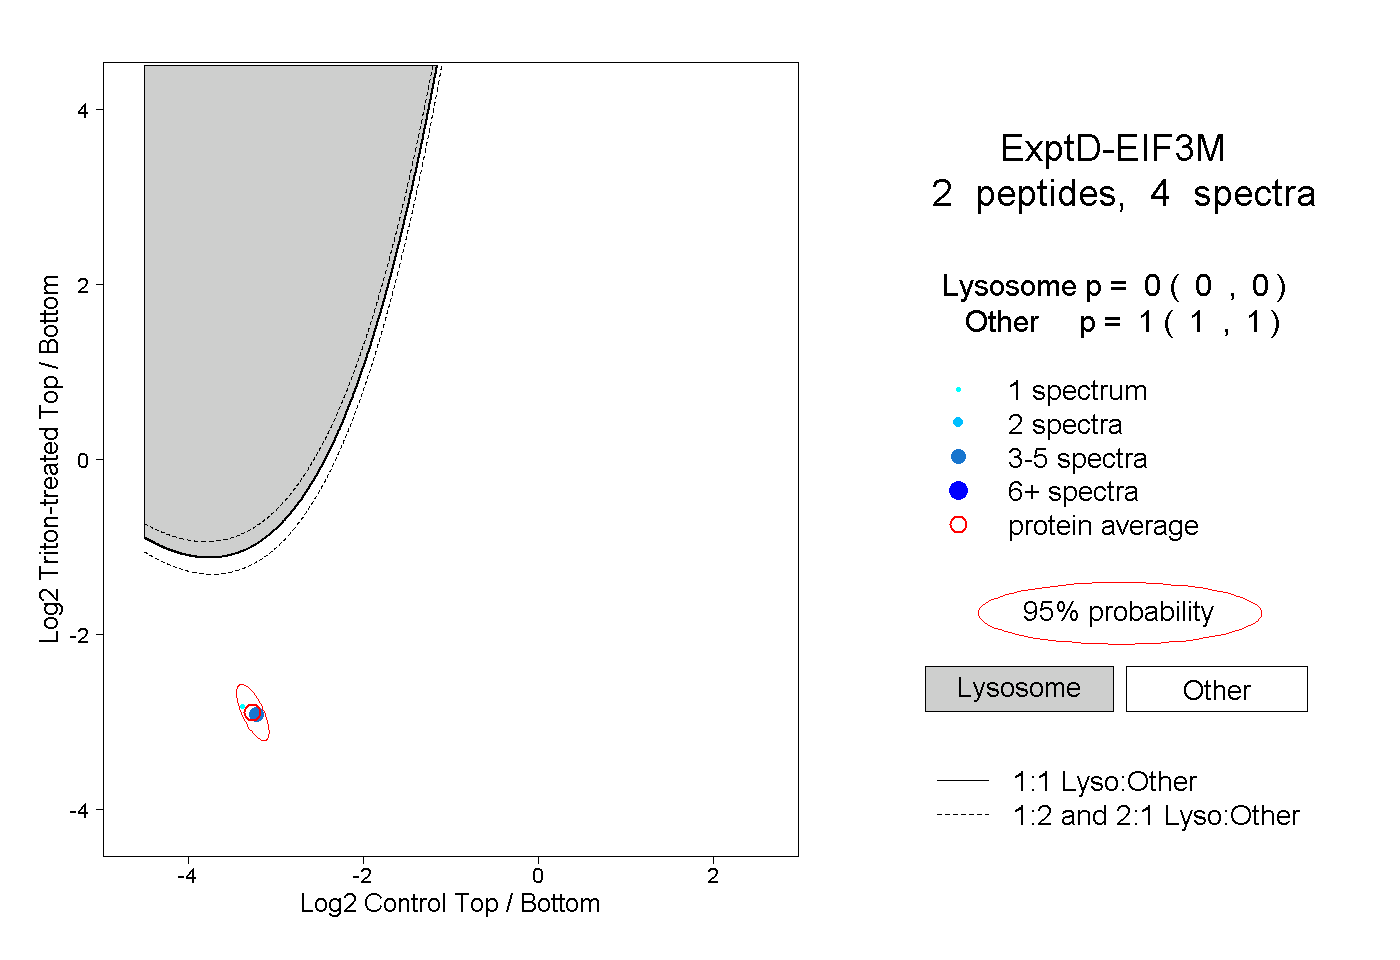
0.000 | 0.000
1.000 | 1.000