EIF3M
[ENSRNOP00000017409]
Main page
| | | Plot |
Mito |
Lyso |
|
Perox |
ER |
Golgi |
PM |
Cytosol |
Nucleus |
|
| Expt A |
 10
10
peptides |
26
spectra |
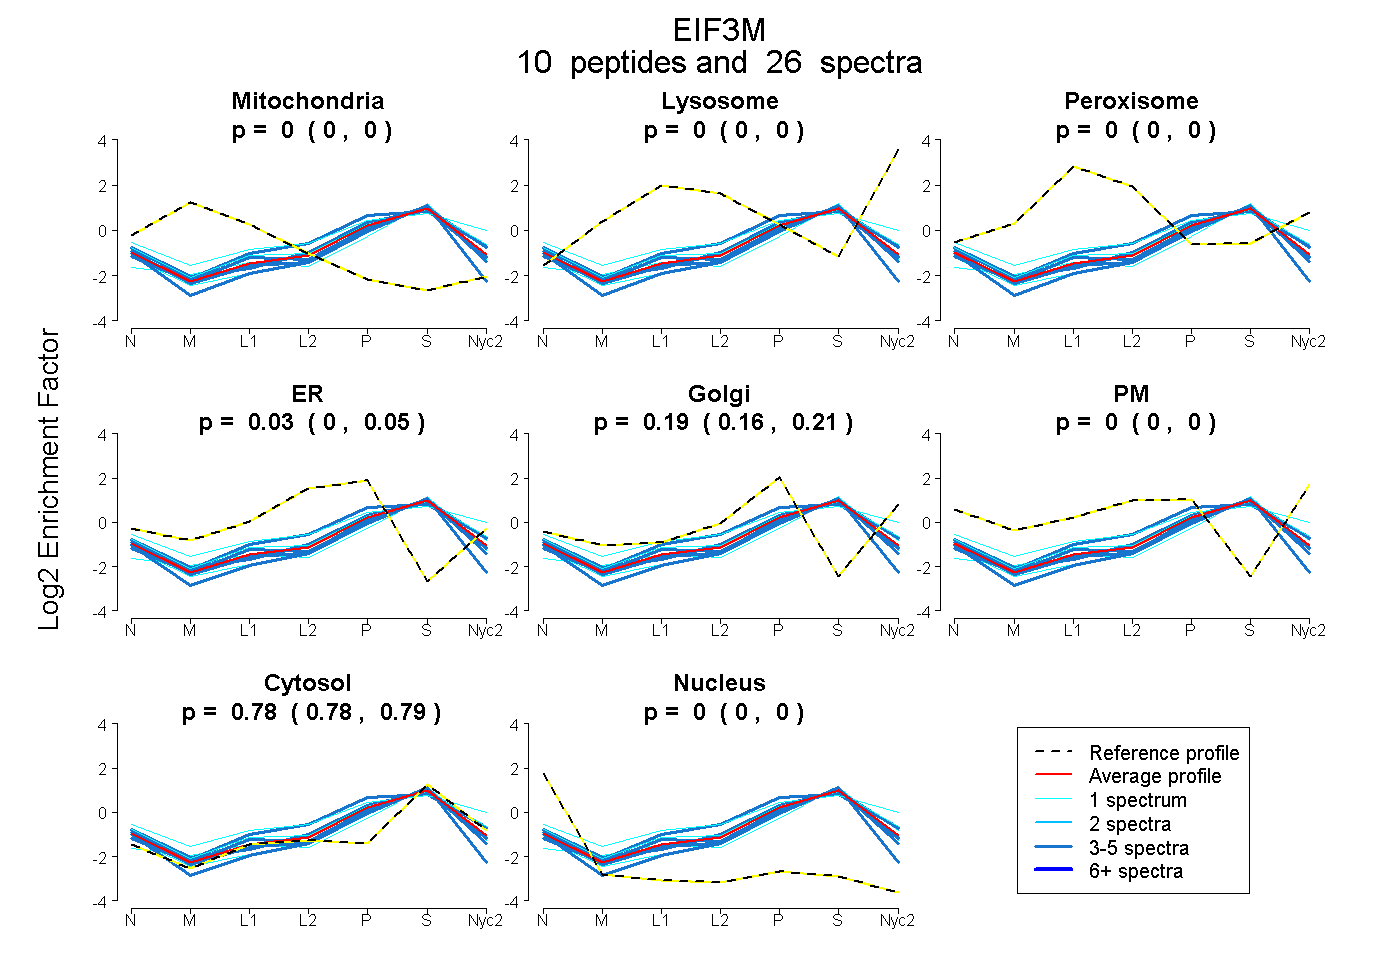 |
0.000
0.000 | 0.000 |
0.000
0.000 | 0.000 |
|
0.000
0.000 | 0.000 |
0.025
0.001 | 0.046 |
0.192
0.164 | 0.214 |
0.000
0.000 | 0.000 |
0.783
0.777 | 0.788 |
0.000
0.000 | 0.000 |
|
| | | Plot |
Mito |
|
Lyso or Perox |
|
ER |
Golgi |
PM |
Cytosol |
Nucleus |
|
| Expt B |
5
peptides |
9
spectra |
 |
0.000
0.000 | 0.000 |
|
0.115
0.078 | 0.147 |
|
0.264
0.186 | 0.326 |
0.060
0.000 | 0.116 |
0.000
0.000 | 0.000 |
0.561
0.532 | 0.583 |
0.000
0.000 | 0.000 |
|
| | | Plot |
|
Lyso |
|
|
|
|
|
|
|
Other |
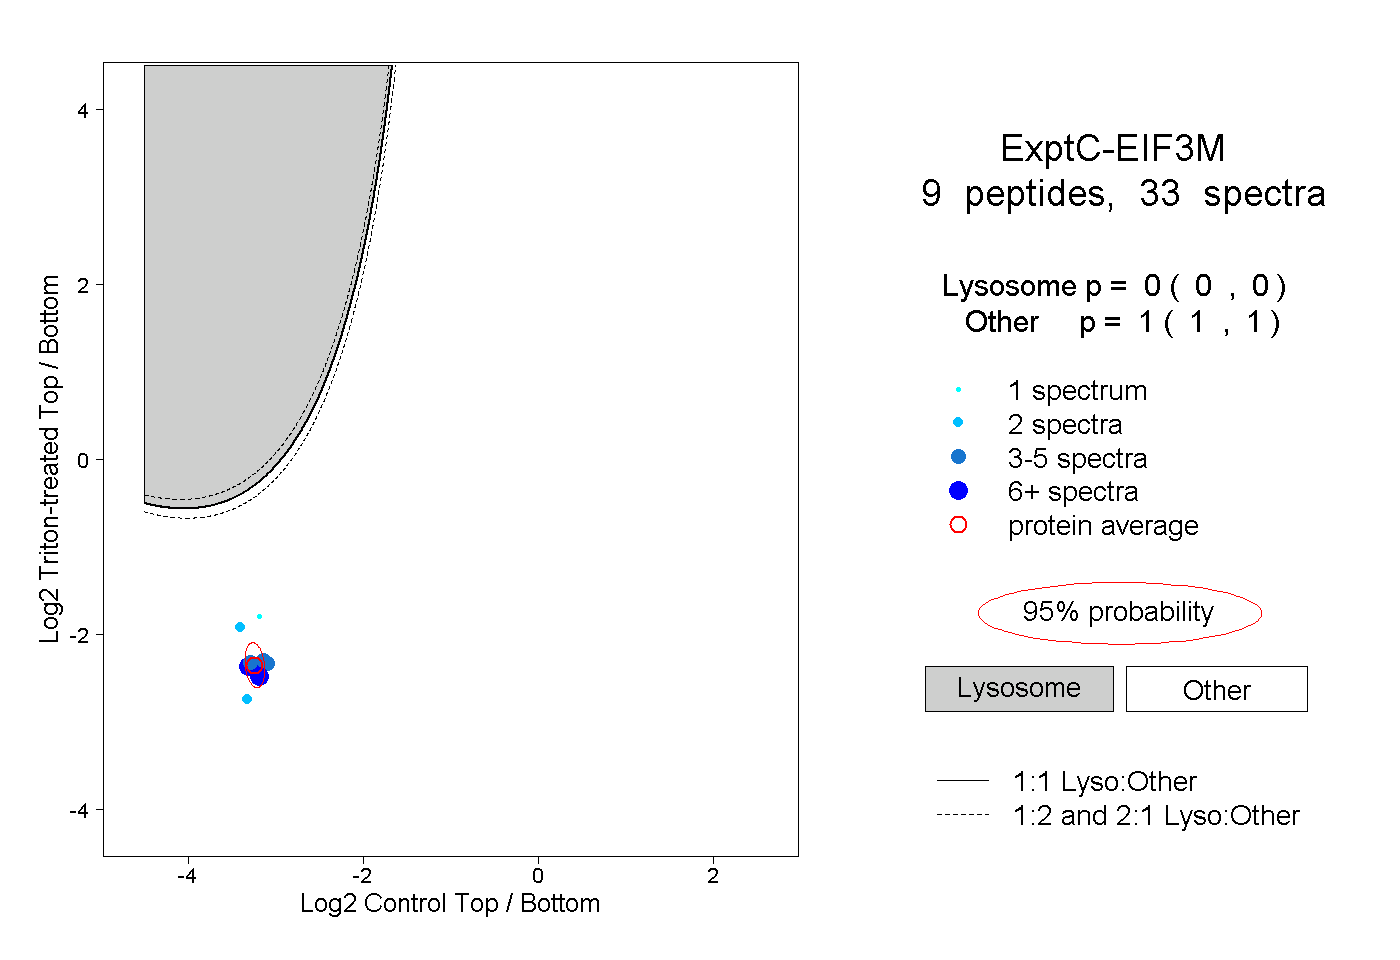
| Expt C |
9
peptides |
33
spectra |
 |
|
0.000
0.000 | 0.000 |
|
|
|
|
|
|
|
1.000
1.000 | 1.000 |
| 2 spectra, LLTFMGMAVENK |
|
0.000 |
|
|
|
|
|
|
|
1.000 |
| 1 spectrum, LASYVK |
|
0.000 |
|
|
|
|
|
|
|
1.000 |
| 6 spectra, IDQTQR |
|
0.000 |
|
|
|
|
|
|
|
1.000 |
| 6 spectra, EGERPSLR |
|
0.000 |
|
|
|
|
|
|
|
1.000 |
| 4 spectra, YTVYCSLIK |
|
0.000 |
|
|
|
|
|
|
|
1.000 |
| 6 spectra, LTTEK |
|
0.000 |
|
|
|
|
|
|
|
1.000 |
| 3 spectra, SDAASK |
|
0.000 |
|
|
|
|
|
|
|
1.000 |
| 3 spectra, FYQNNK |
|
0.000 |
|
|
|
|
|
|
|
1.000 |
| 2 spectra, WISDWK |
|
0.000 |
|
|
|
|
|
|
|
1.000 |
| | | Plot |
|
Lyso |
|
|
|
|
|
|
|
Other |
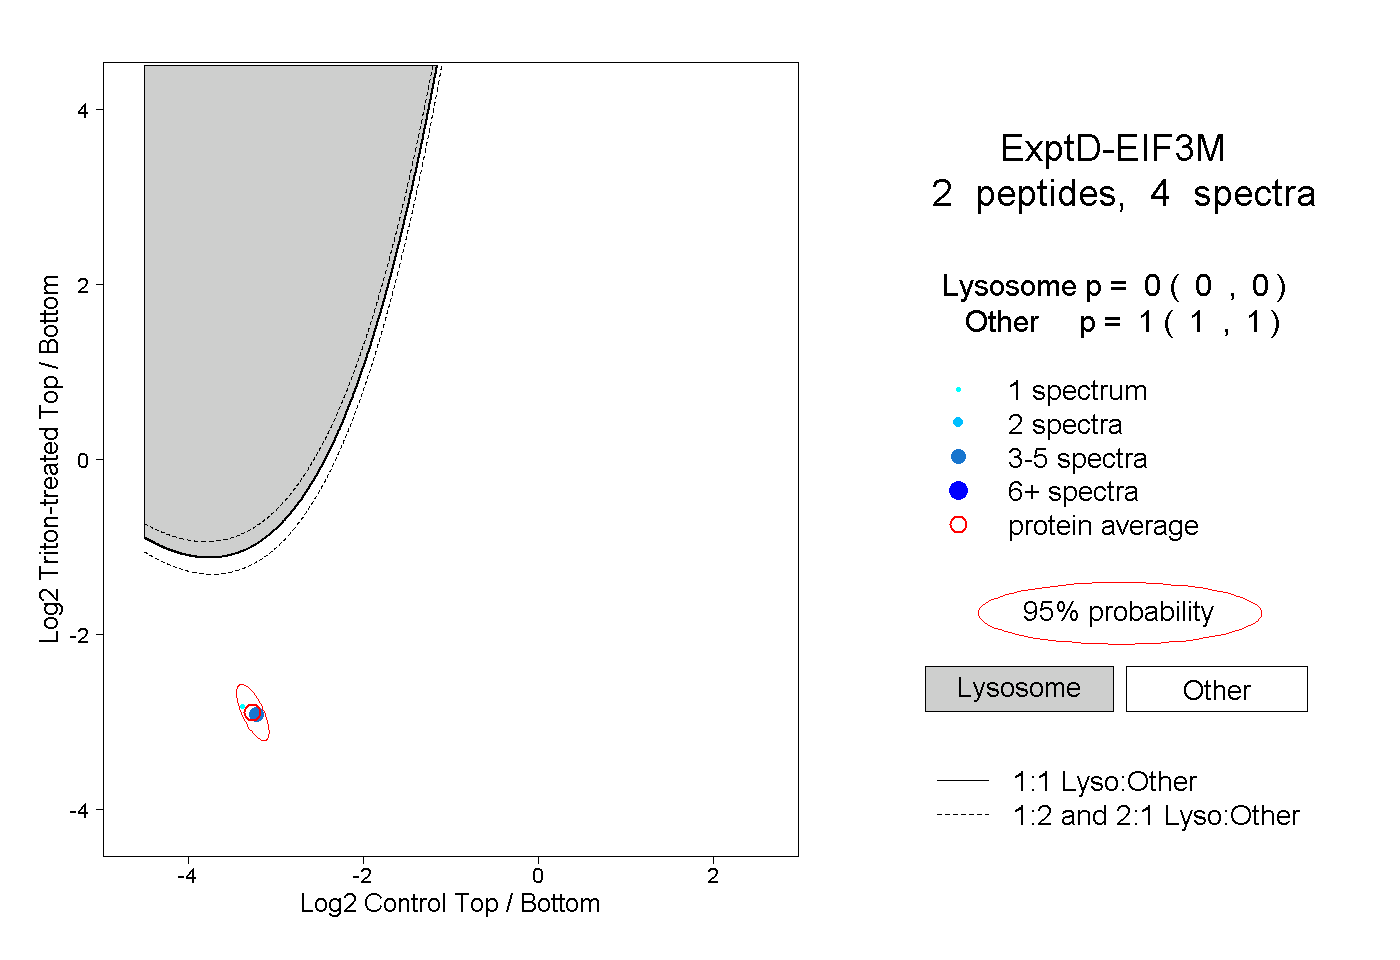
| Expt D |
2
peptides |
4
spectra |
 |
|
0.000
0.000 | 0.000 |
|
|
|
|
|
|
|
1.000
1.000 | 1.000 |