 8
8peptides
spectra
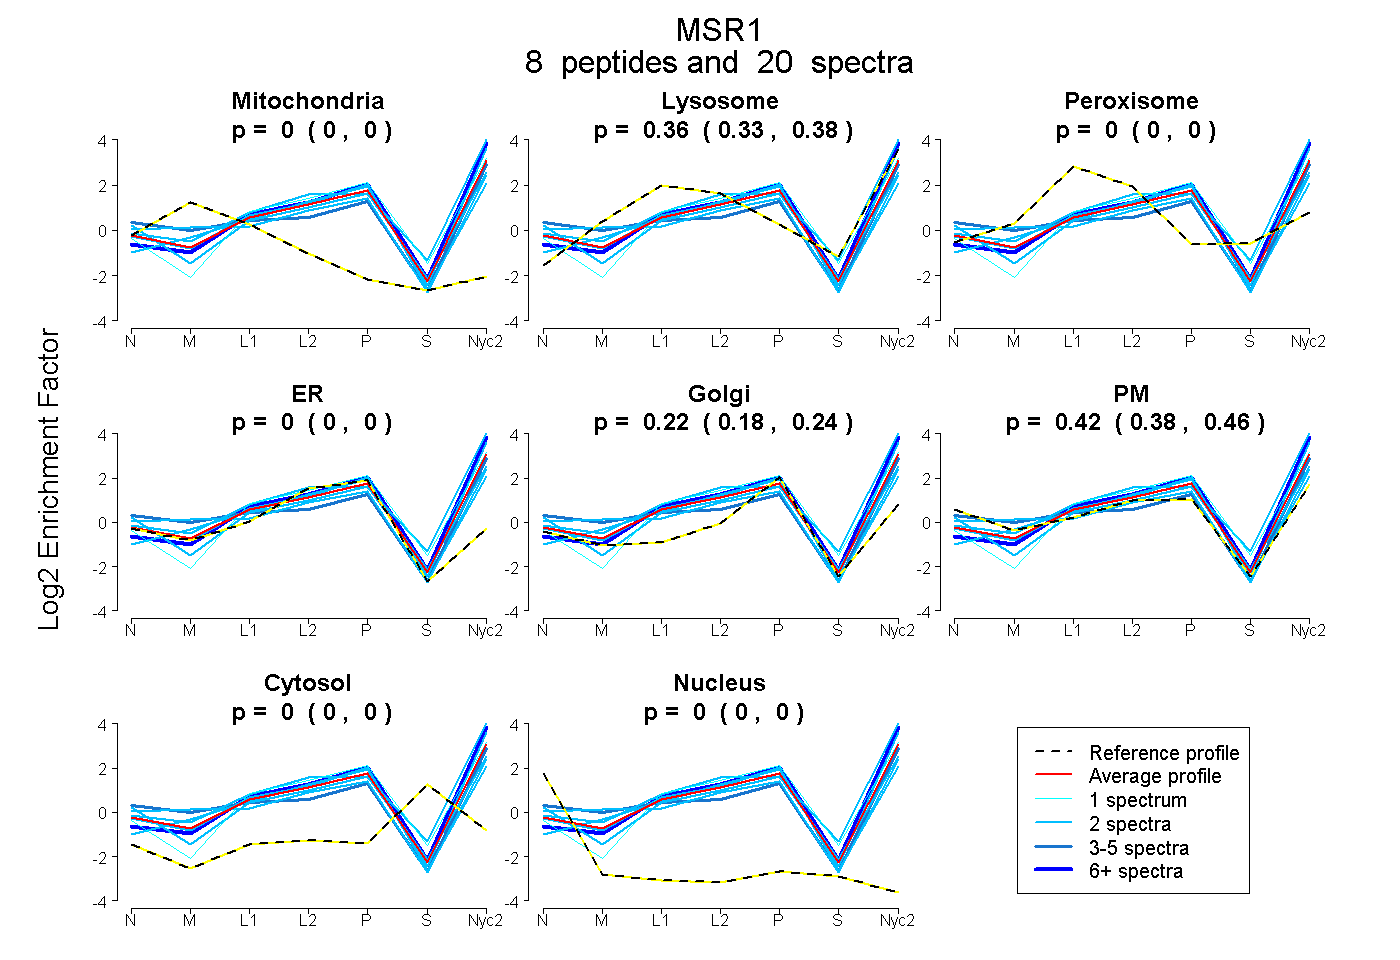
0.000 | 0.000
0.334 | 0.379
0.000 | 0.000
0.000 | 0.000
0.182 | 0.245
0.379 | 0.464
0.000 | 0.000
0.000 | 0.000
1peptide
spectrum
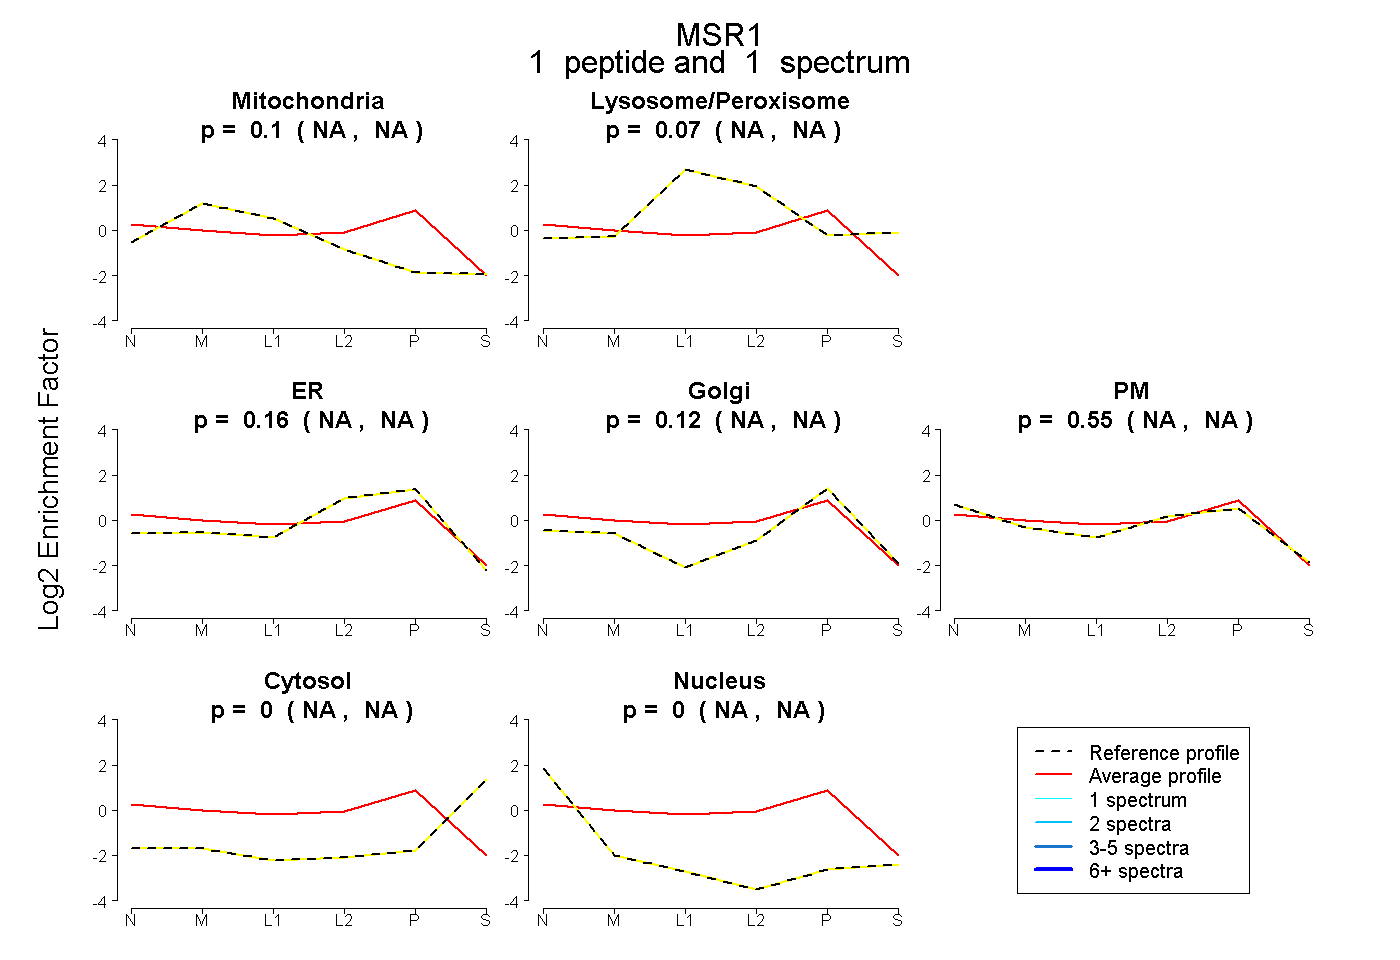
NA | NA
NA | NA
NA | NA
NA | NA
NA | NA
NA | NA
NA | NA
8peptides
spectra
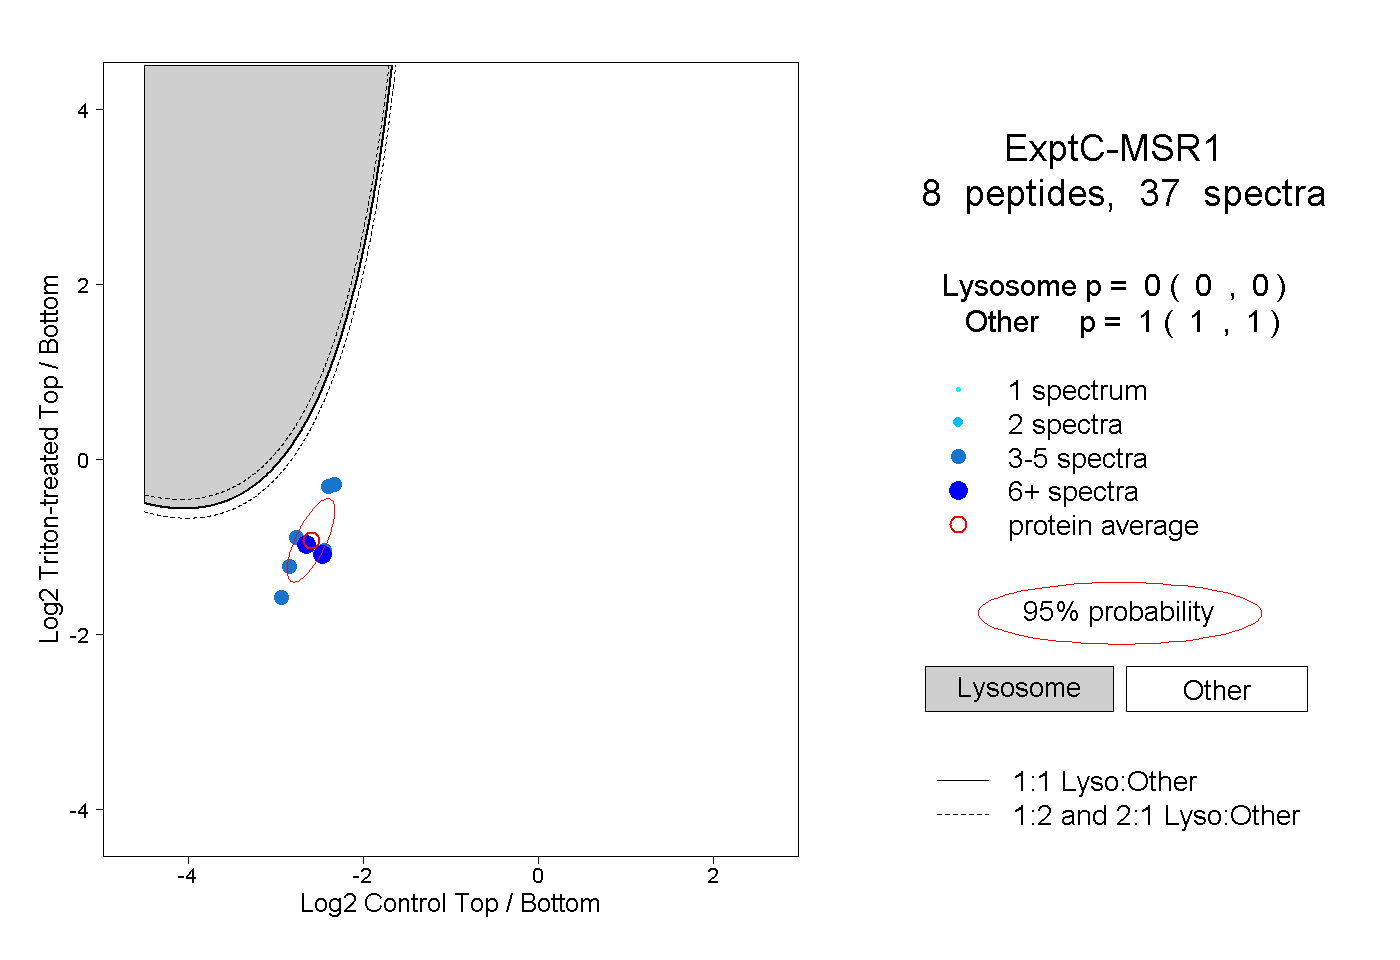
0.000 | 0.000
1.000 | 1.000
3peptides
spectra
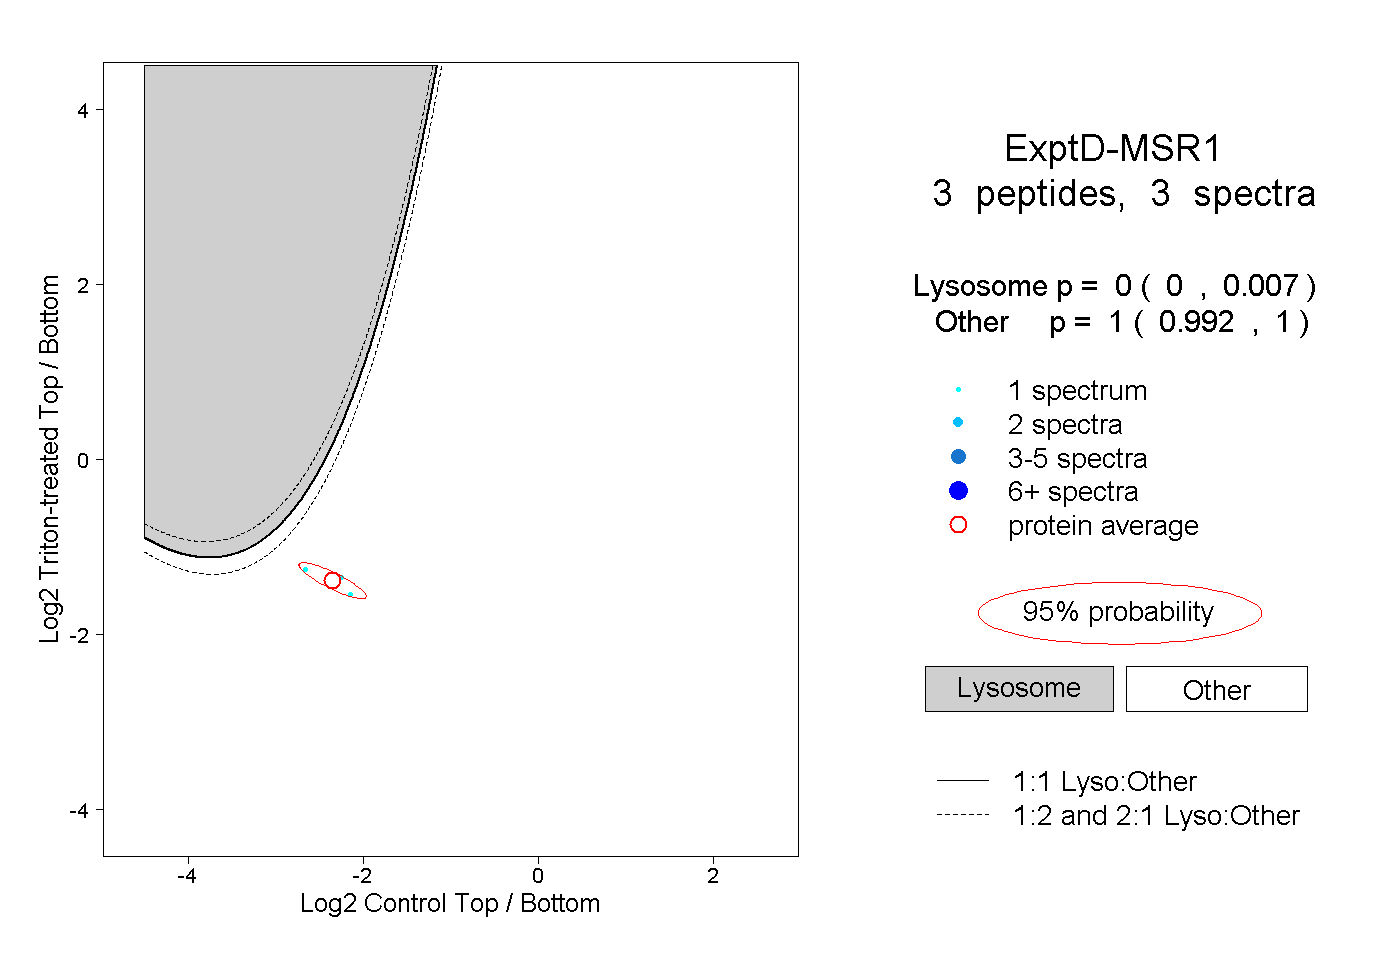
0.000 | 0.007
0.992 | 1.000