MSR1
[ENSRNOP00000017339]
Main page
| | | Plot |
Mito |
Lyso |
|
Perox |
ER |
Golgi |
PM |
Cytosol |
Nucleus |
|
| Expt A |
 8
8
peptides |
20
spectra |
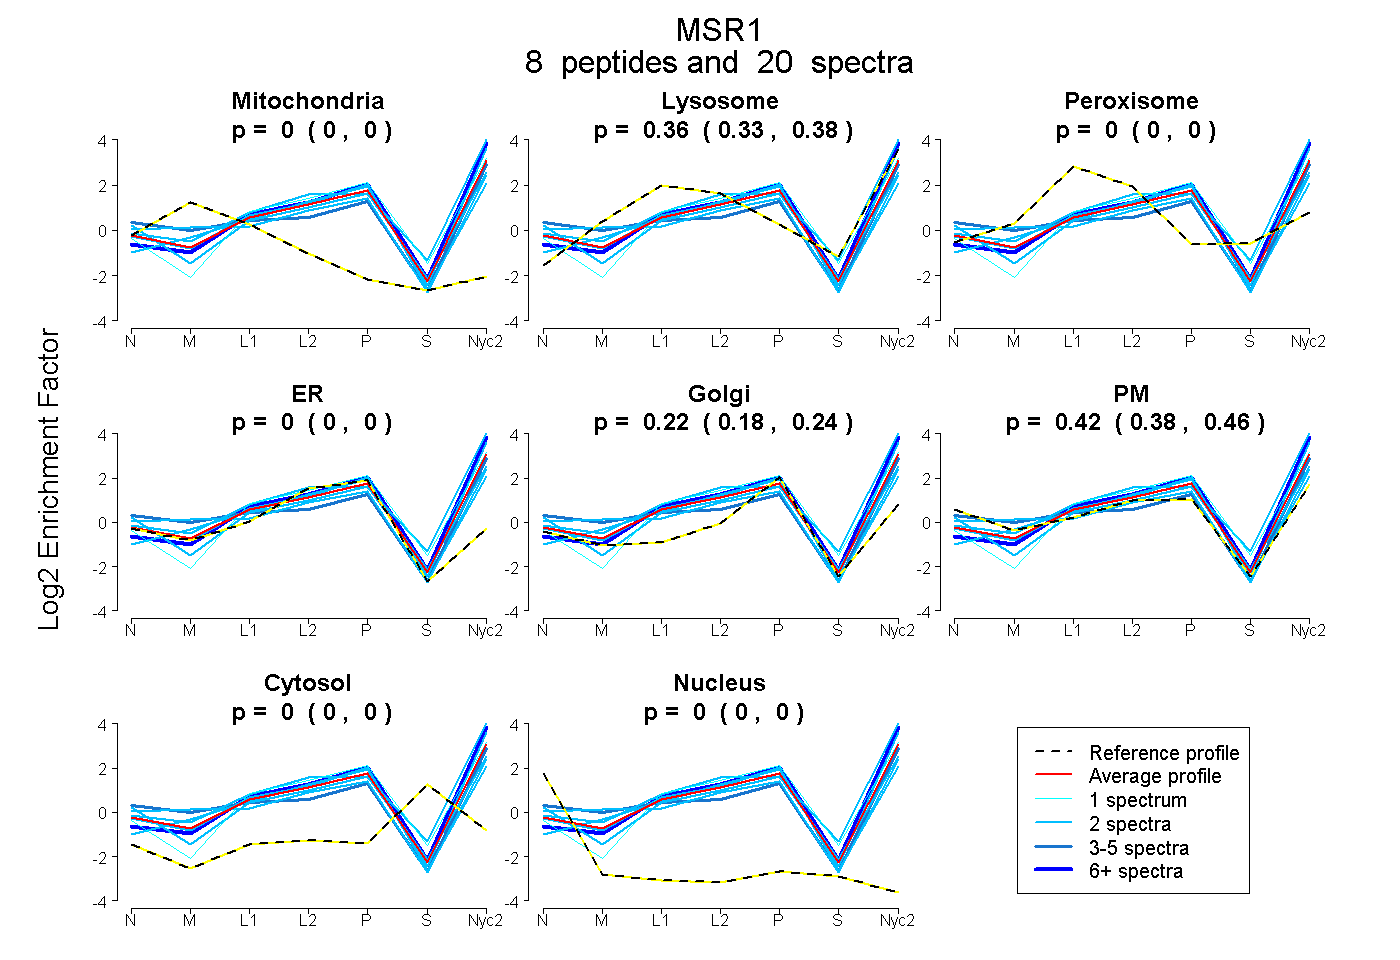 |
0.000
0.000 | 0.000 |
0.359
0.334 | 0.379 |
|
0.000
0.000 | 0.000 |
0.000
0.000 | 0.000 |
0.217
0.182 | 0.245 |
0.424
0.379 | 0.464 |
0.000
0.000 | 0.000 |
0.000
0.000 | 0.000 |
|
| | | Plot |
Mito |
|
Lyso or Perox |
|
ER |
Golgi |
PM |
Cytosol |
Nucleus |
|
| Expt B |
1
peptide |
1
spectrum |
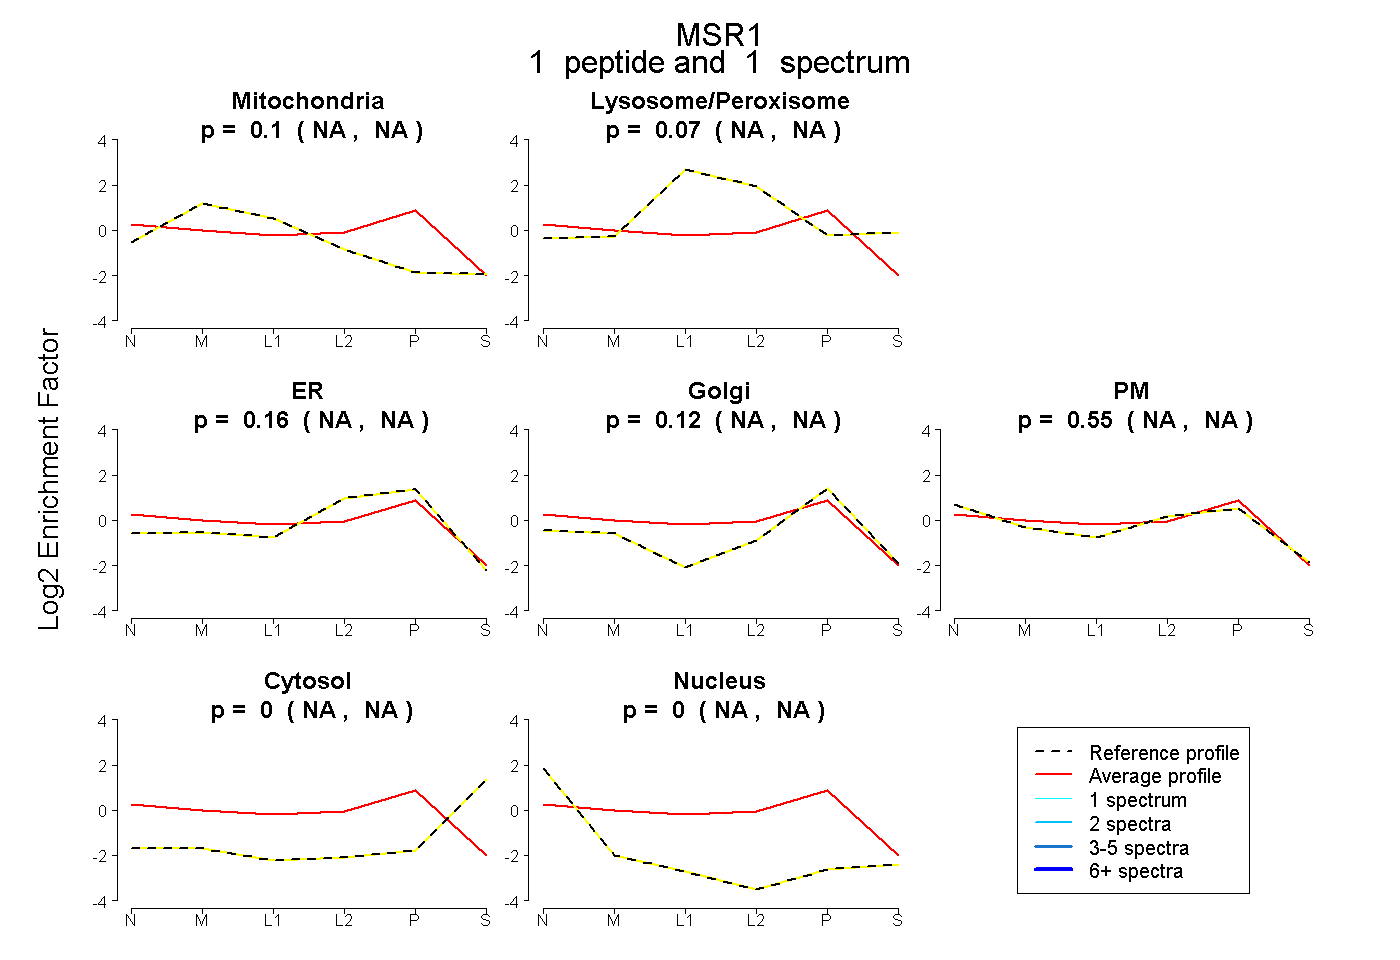 |
0.096
NA | NA |
|
0.072
NA | NA |
|
0.160
NA | NA |
0.120
NA | NA |
0.551
NA | NA |
0.000
NA | NA |
0.000
NA | NA |
|
| | | Plot |
|
Lyso |
|
|
|
|
|
|
|
Other |
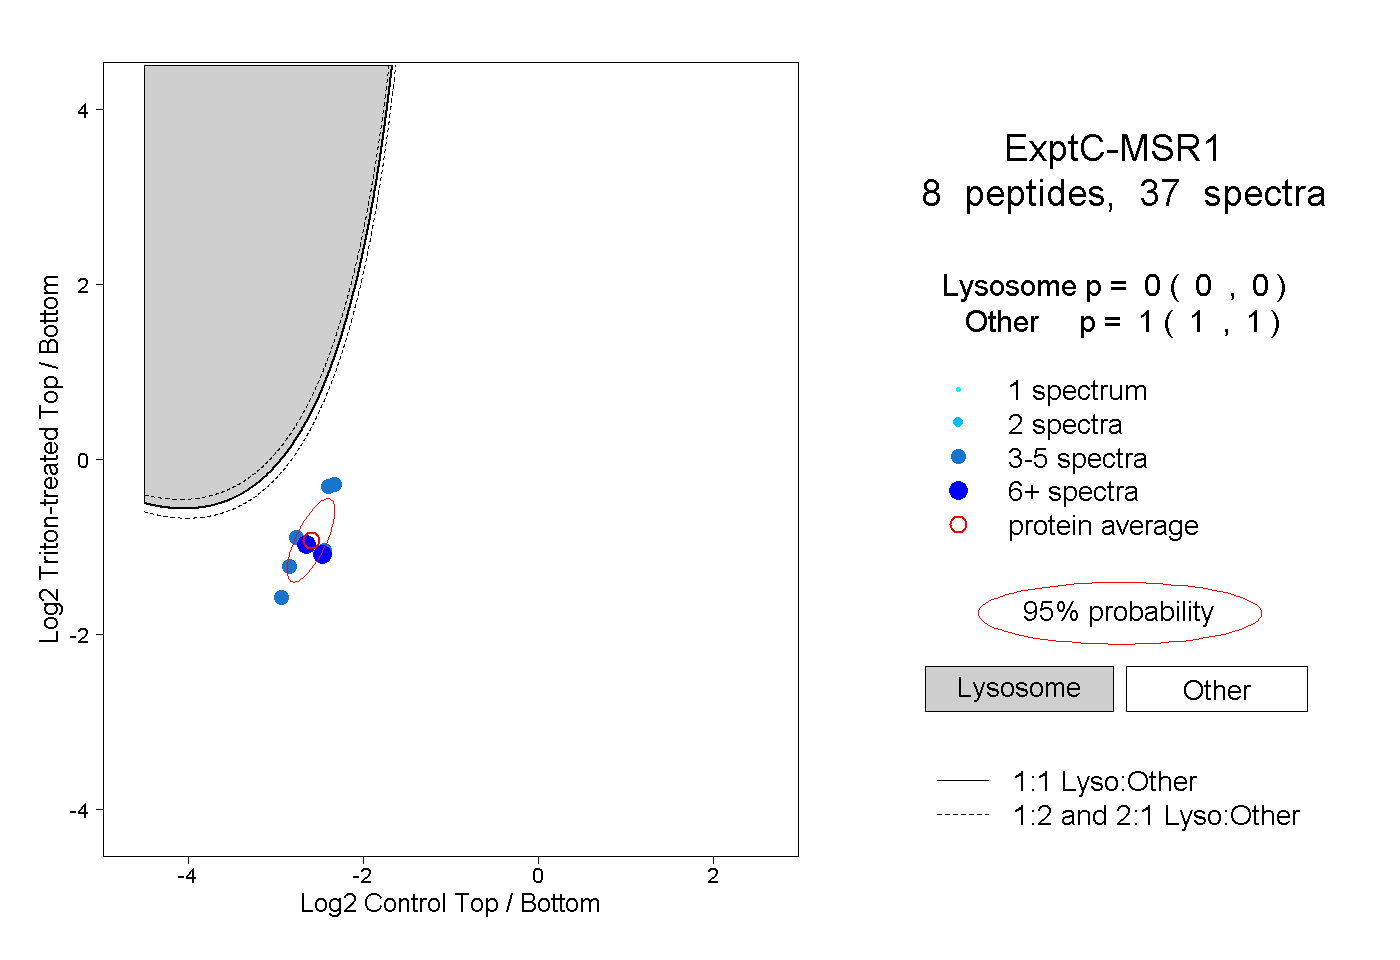
| Expt C |
8
peptides |
37
spectra |
 |
|
0.000
0.000 | 0.000 |
|
|
|
|
|
|
|
1.000
1.000 | 1.000 |
| 3 spectra, AEMGFTIAMER |
|
0.000 |
|
|
|
|
|
|
|
1.000 |
| 3 spectra, SLGYQDVLTVHK |
|
0.000 |
|
|
|
|
|
|
|
1.000 |
| 3 spectra, AGISTSLK |
|
0.000 |
|
|
|
|
|
|
|
1.000 |
| 5 spectra, QQEDISK |
|
0.000 |
|
|
|
|
|
|
|
1.000 |
| 4 spectra, AGLLDTDR |
|
0.000 |
|
|
|
|
|
|
|
1.000 |
| 6 spectra, ESSIENCK |
|
0.000 |
|
|
|
|
|
|
|
1.000 |
| 8 spectra, VQSISDSK |
|
0.000 |
|
|
|
|
|
|
|
1.000 |
| 5 spectra, AGQVVCR |
|
0.000 |
|
|
|
|
|
|
|
1.000 |
| | | Plot |
|
Lyso |
|
|
|
|
|
|
|
Other |
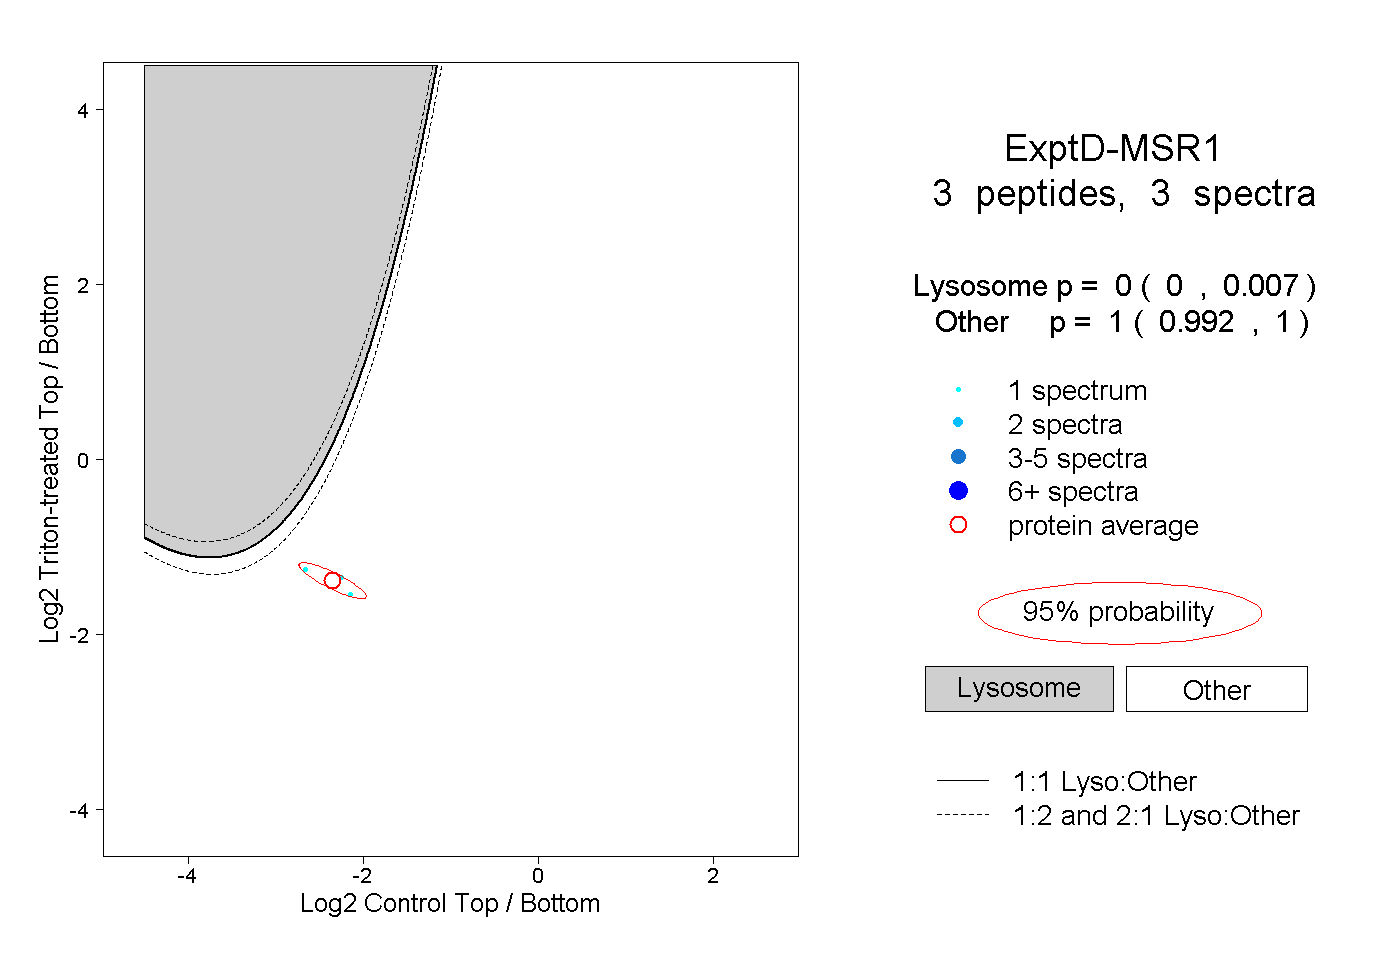
| Expt D |
3
peptides |
3
spectra |
 |
|
0.000
0.000 | 0.007 |
|
|
|
|
|
|
|
1.000
0.992 | 1.000 |