 5
5peptides
spectra
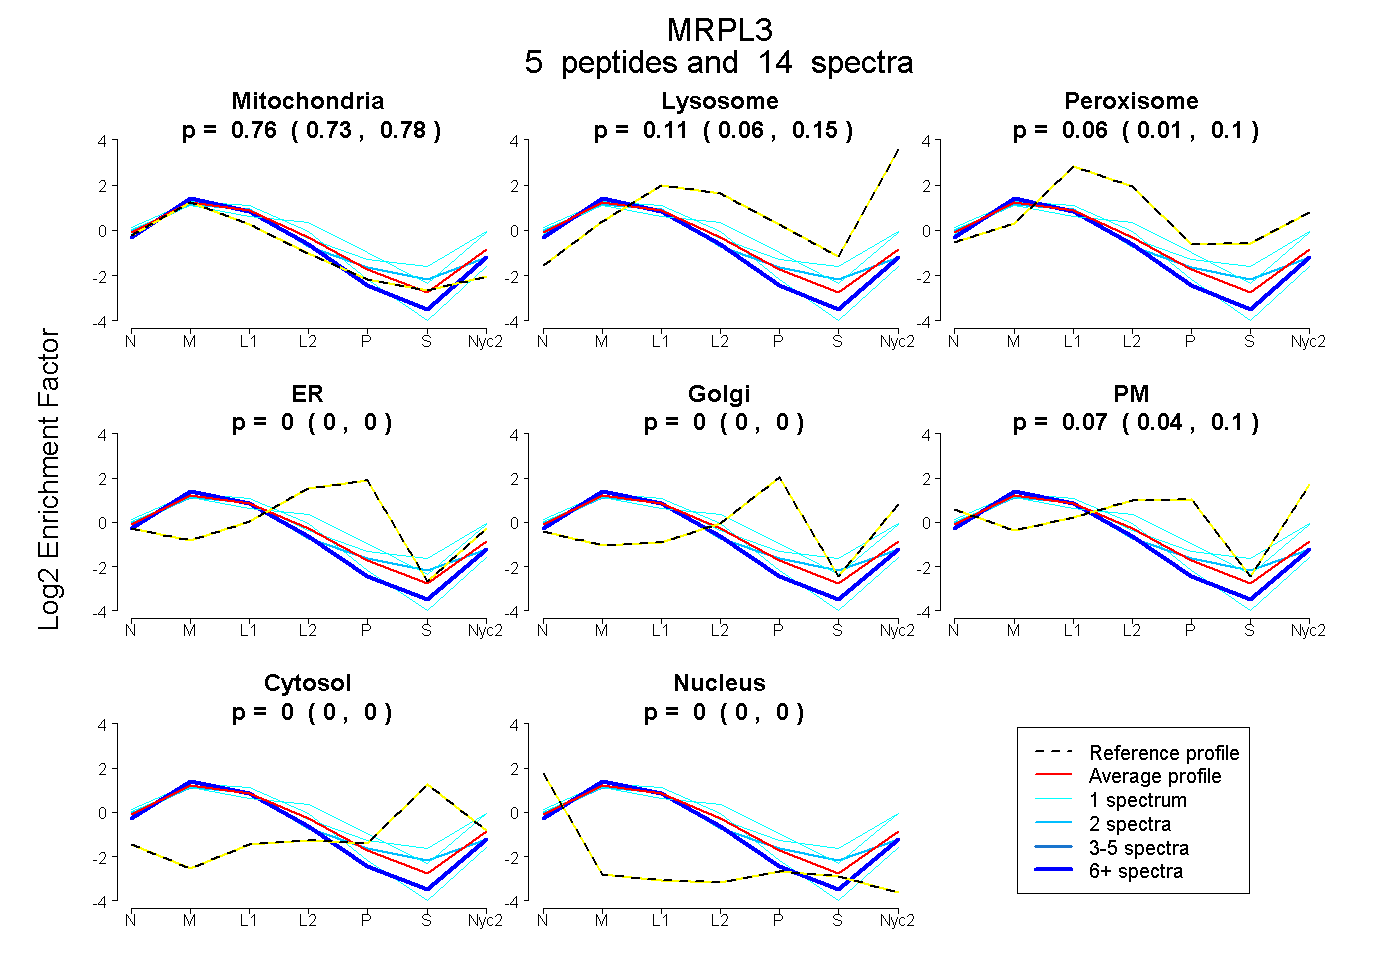
0.734 | 0.780
0.063 | 0.150
0.010 | 0.104
0.000 | 0.000
0.000 | 0.000
0.037 | 0.099
0.000 | 0.000
0.000 | 0.000
2peptides
spectra
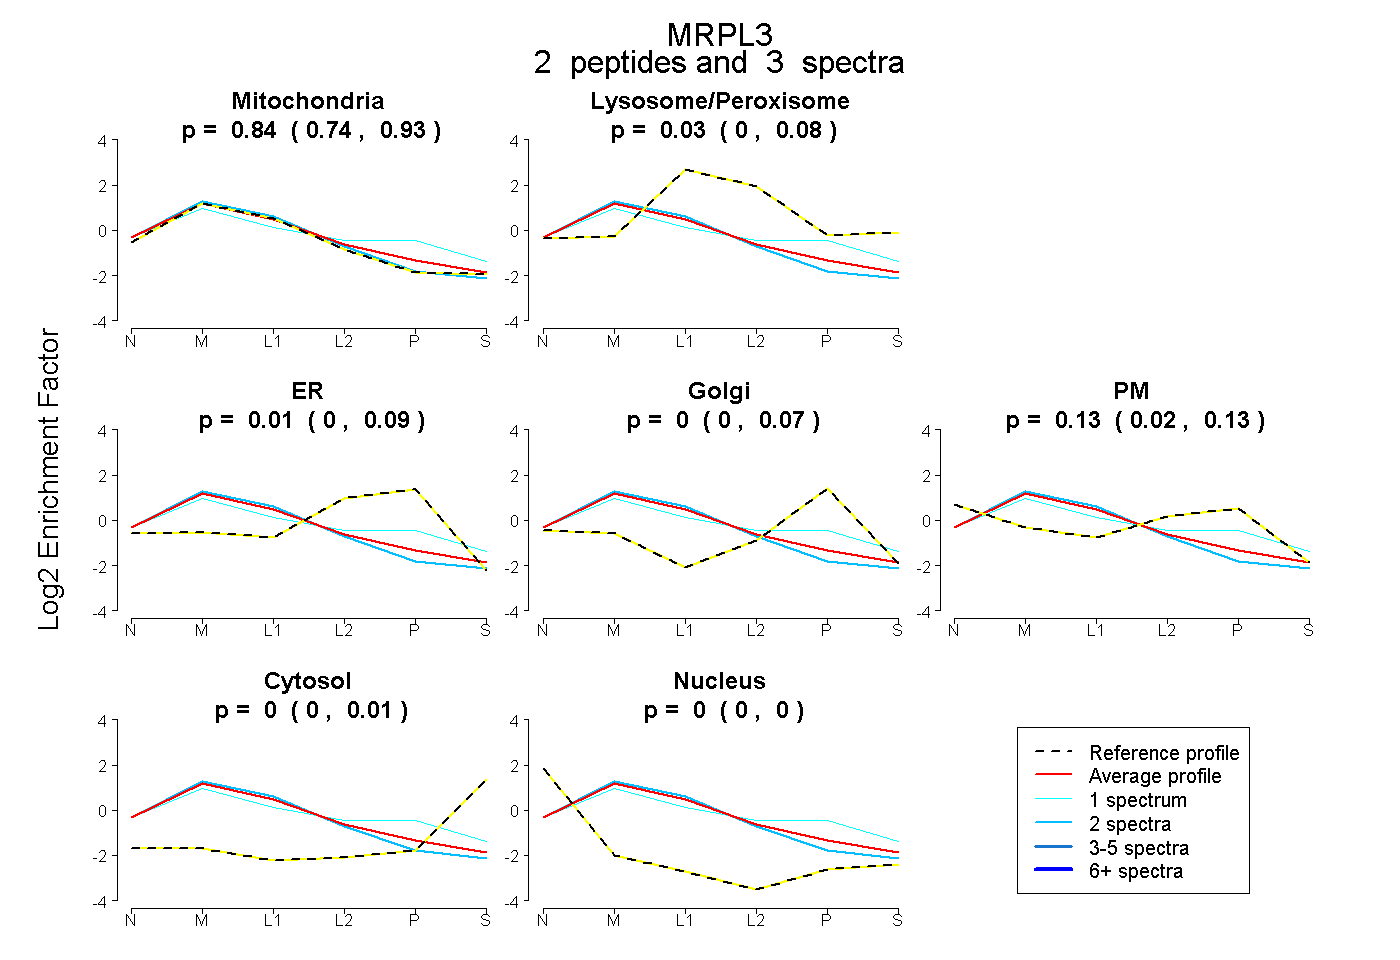
0.736 | 0.927
0.000 | 0.083
0.000 | 0.091
0.000 | 0.075
0.022 | 0.131
0.000 | 0.006
0.000 | 0.003
15peptides
spectra
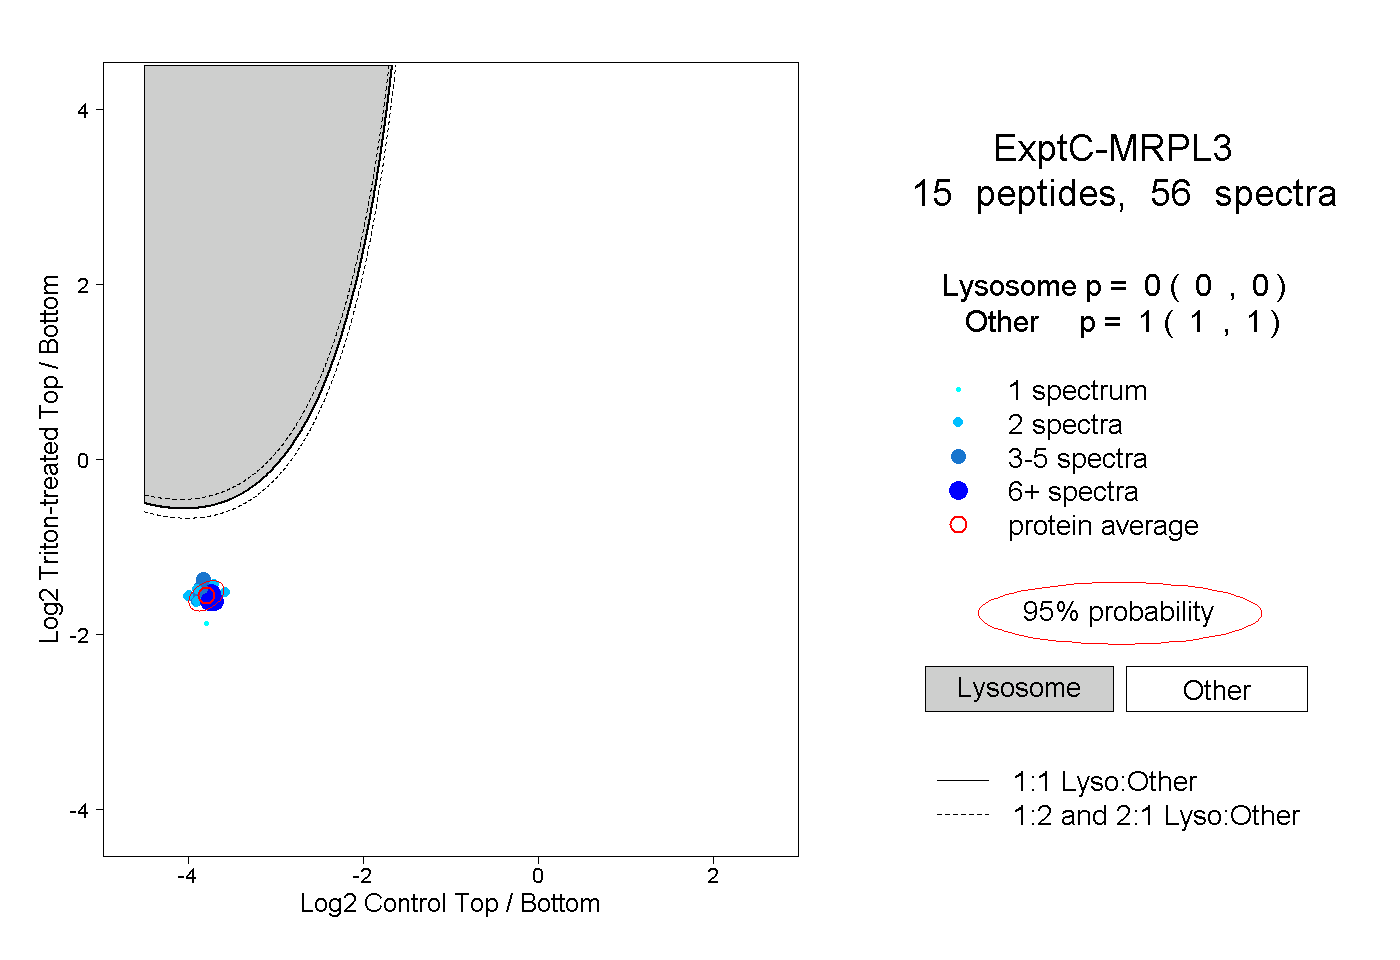
0.000 | 0.000
1.000 | 1.000
5peptides
spectra
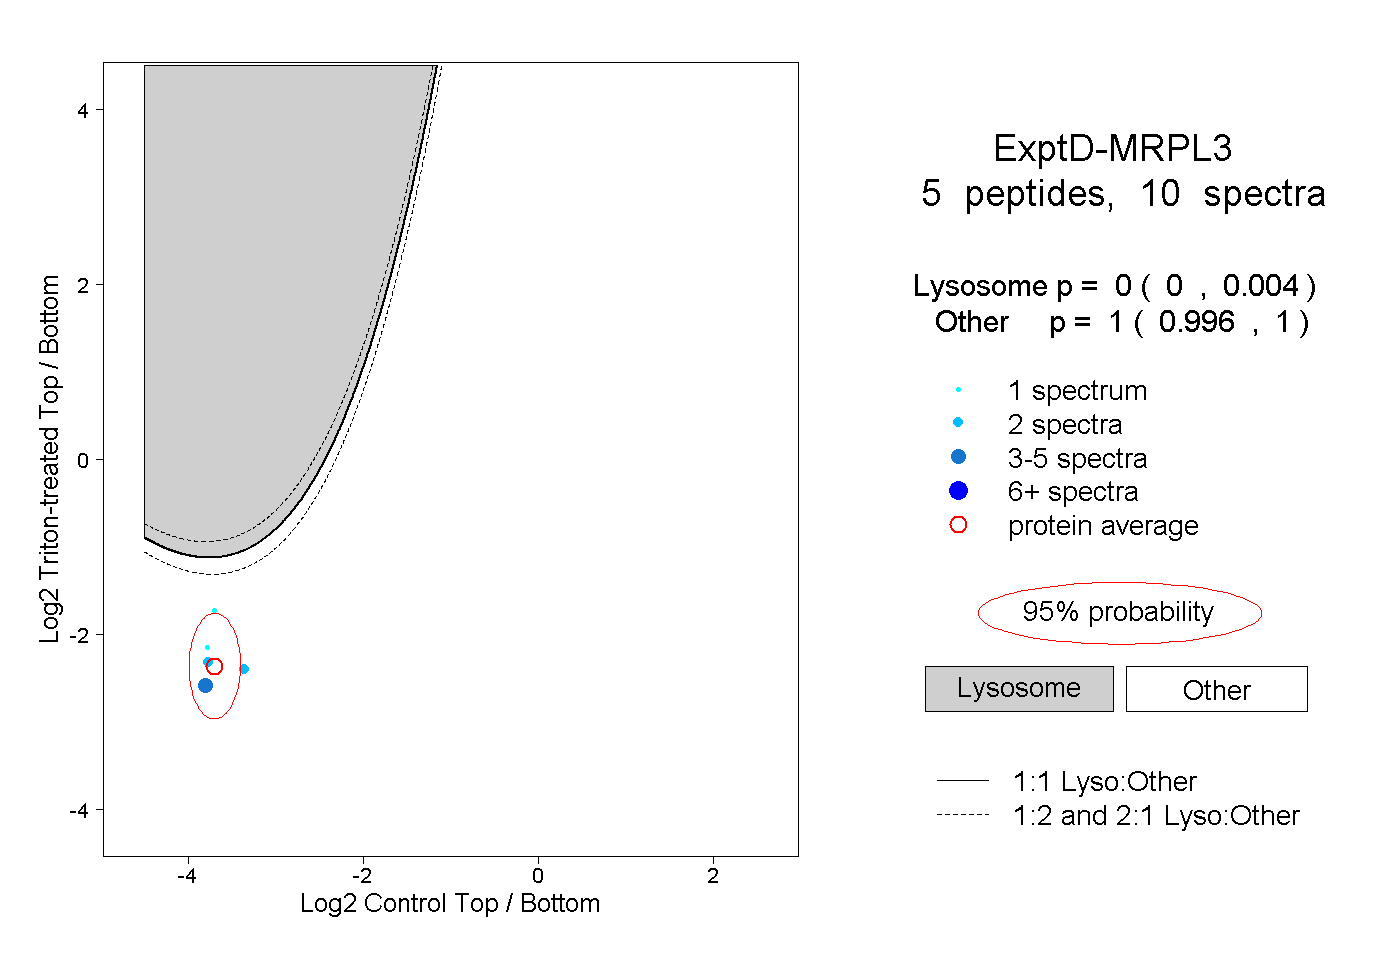
0.000 | 0.004
0.996 | 1.000