 5
5peptides
spectra
0.734 | 0.780
0.063 | 0.150
0.010 | 0.104
0.000 | 0.000
0.000 | 0.000
0.037 | 0.099
0.000 | 0.000
0.000 | 0.000
| Plot | Mito | Lyso | Perox | ER | Golgi | PM | Cytosol | Nucleus | |||||
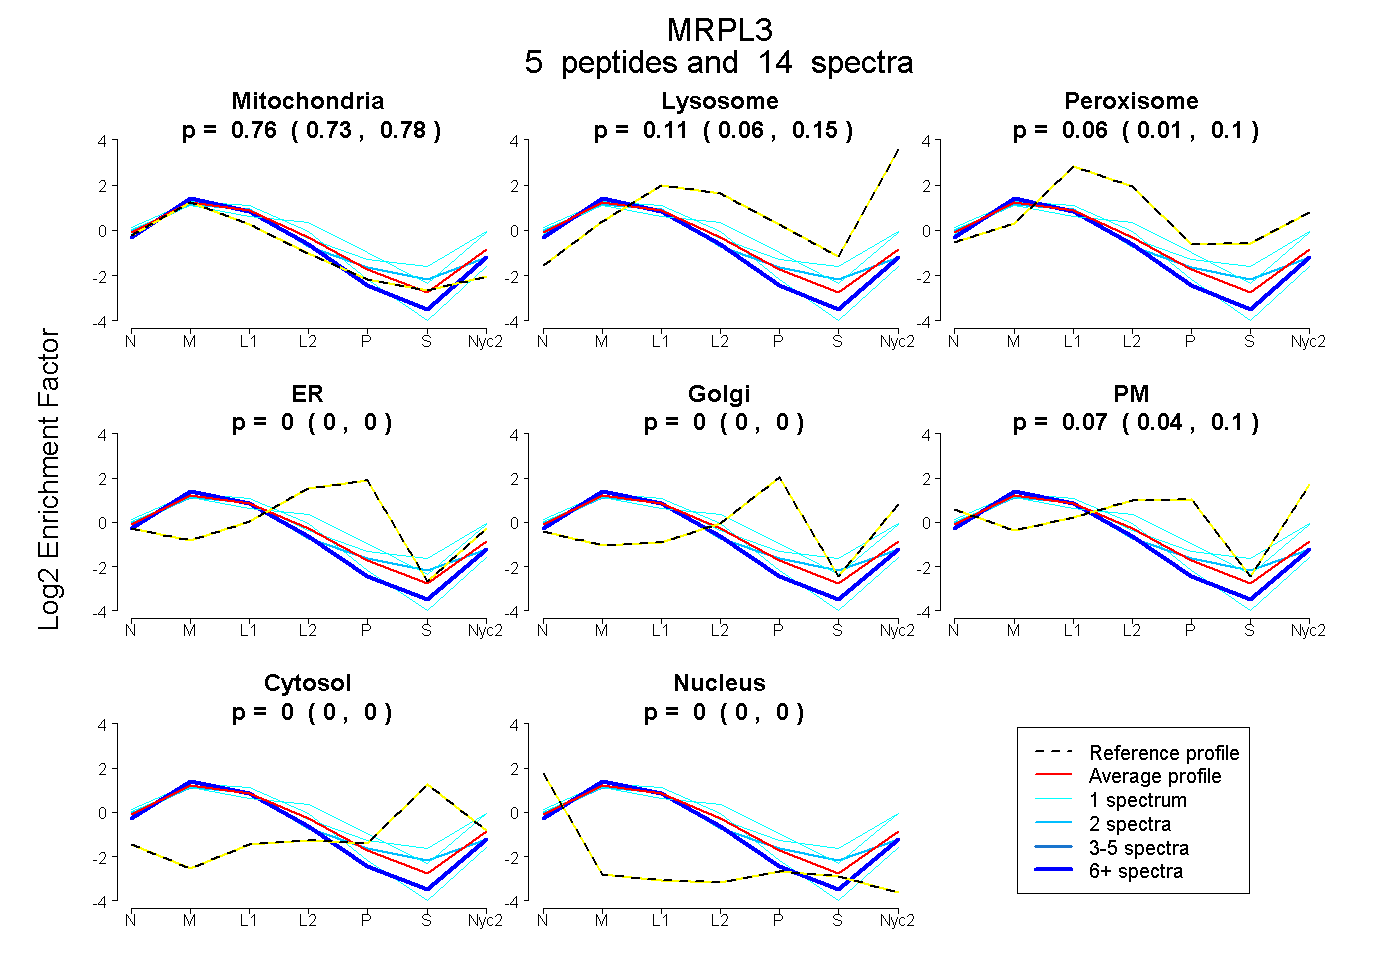
| Expt A |
5 peptides |
14 spectra |
|
0.758 0.734 | 0.780 |
0.111 0.063 | 0.150 |
0.061 0.010 | 0.104 |
0.000 0.000 | 0.000 |
0.000 0.000 | 0.000 |
0.070 0.037 | 0.099 |
0.000 0.000 | 0.000 |
0.000 0.000 | 0.000 |
| 2 spectra, LYKPNSILEFYR | 0.771 | 0.010 | 0.172 | 0.000 | 0.000 | 0.047 | 0.000 | 0.000 | ||
| 1 spectrum, GFQGVMK | 0.602 | 0.252 | 0.090 | 0.000 | 0.000 | 0.031 | 0.026 | 0.000 | ||
| 1 spectrum, RPGAISTGDIAR | 0.529 | 0.114 | 0.095 | 0.000 | 0.000 | 0.263 | 0.000 | 0.000 | ||
| 1 spectrum, GQPASHGQTK | 0.872 | 0.000 | 0.055 | 0.000 | 0.000 | 0.074 | 0.000 | 0.000 | ||
| 9 spectra, MPGQMGNQNR | 0.910 | 0.090 | 0.000 | 0.000 | 0.000 | 0.000 | 0.000 | 0.000 |
| Plot | Mito | Lyso or Perox | ER | Golgi | PM | Cytosol | Nucleus | ||||||
| Expt B |
2 peptides |
3 spectra |
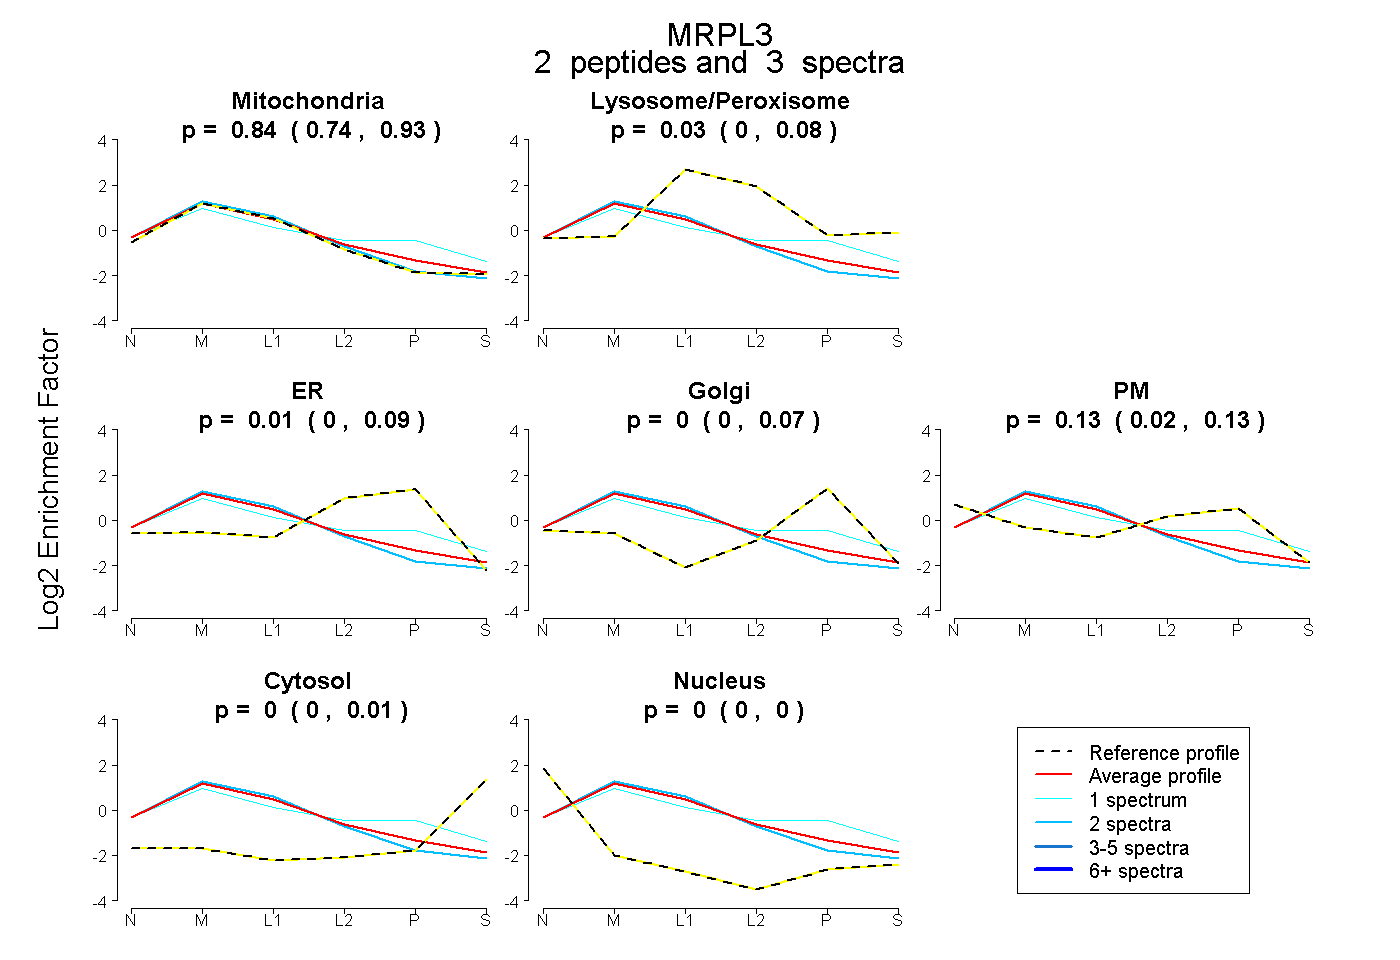 |
0.837 0.736 | 0.927 |
0.027 0.000 | 0.083 |
0.007 0.000 | 0.091 |
0.000 0.000 | 0.075 |
0.128 0.022 | 0.131 |
0.000 0.000 | 0.006 |
0.000 0.000 | 0.003 |
|||
| Plot | Lyso | Other | |||||||||||
| Expt C |
15 peptides |
56 spectra |
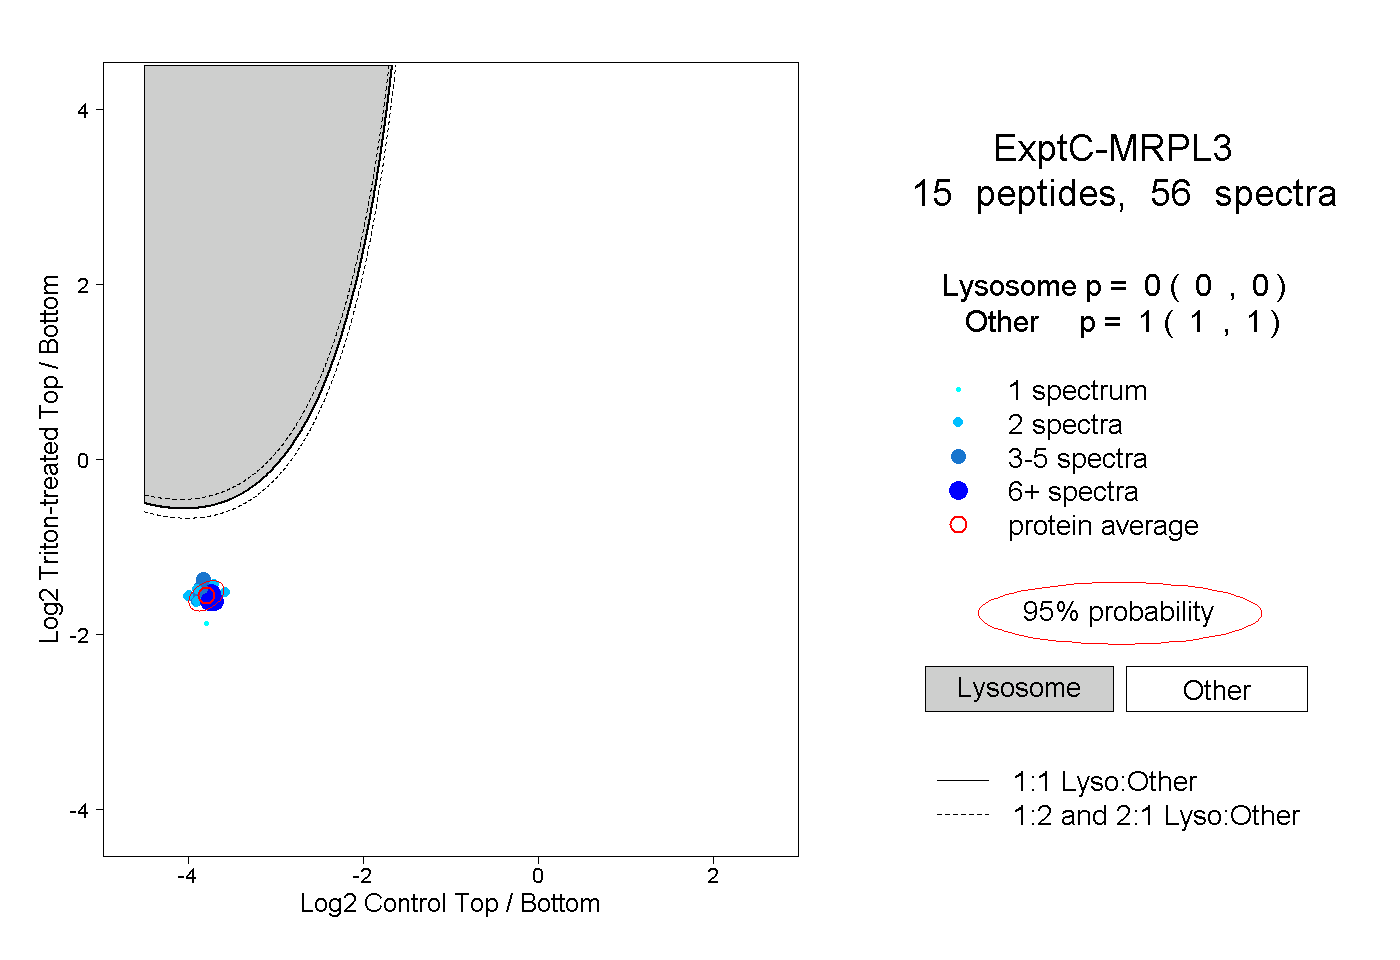 |
0.000 0.000 | 0.000 |
1.000 1.000 | 1.000 |
||||||||
| Plot | Lyso | Other | |||||||||||
| Expt D |
5 peptides |
10 spectra |
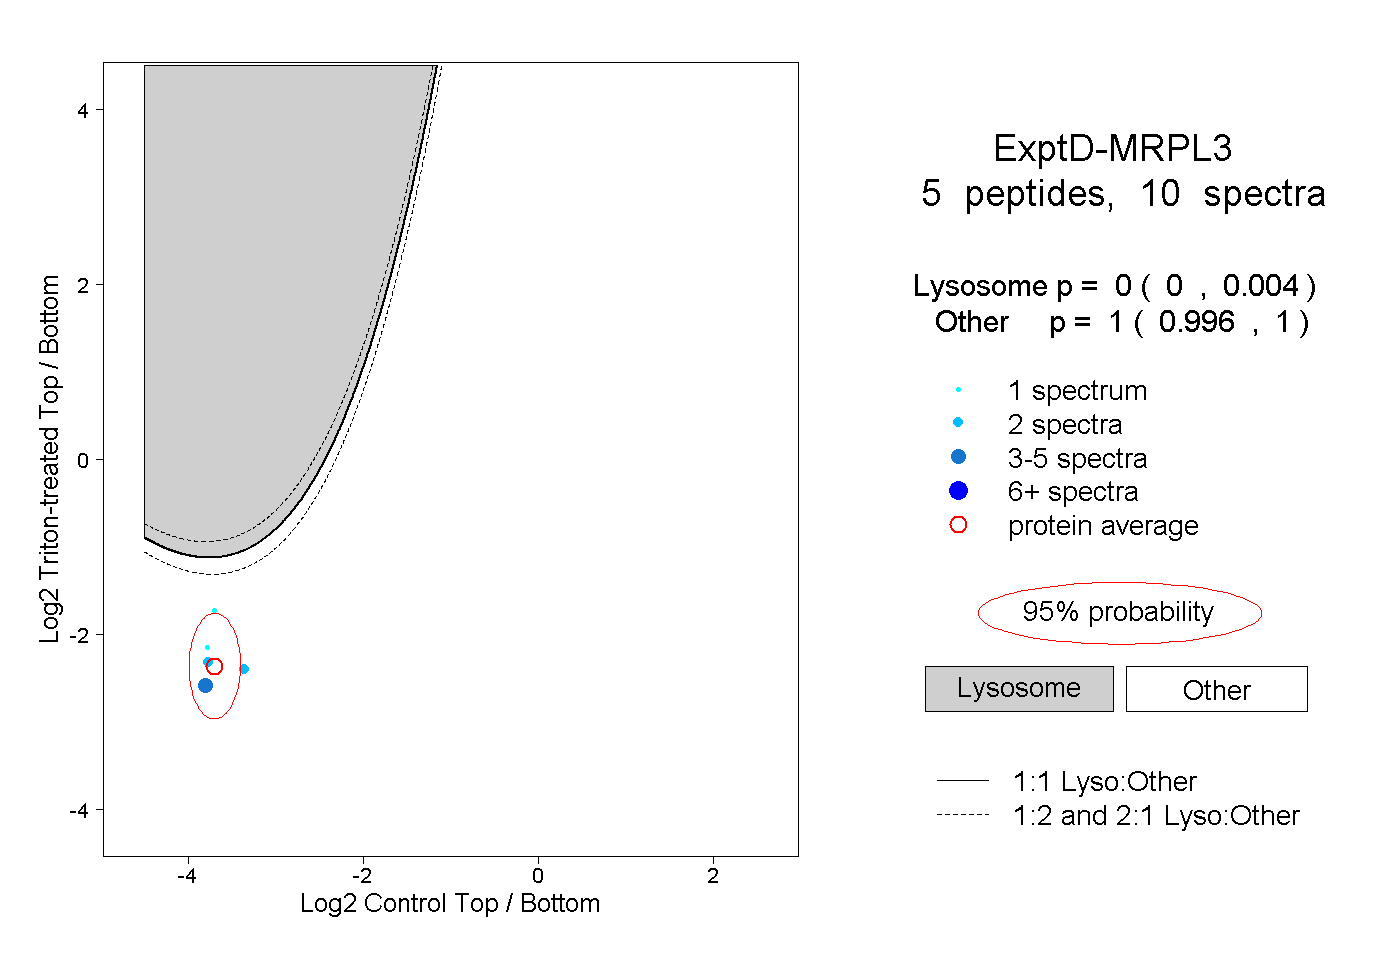 |
0.000 0.000 | 0.004 |
1.000 0.996 | 1.000 |