 5
5peptides
spectra
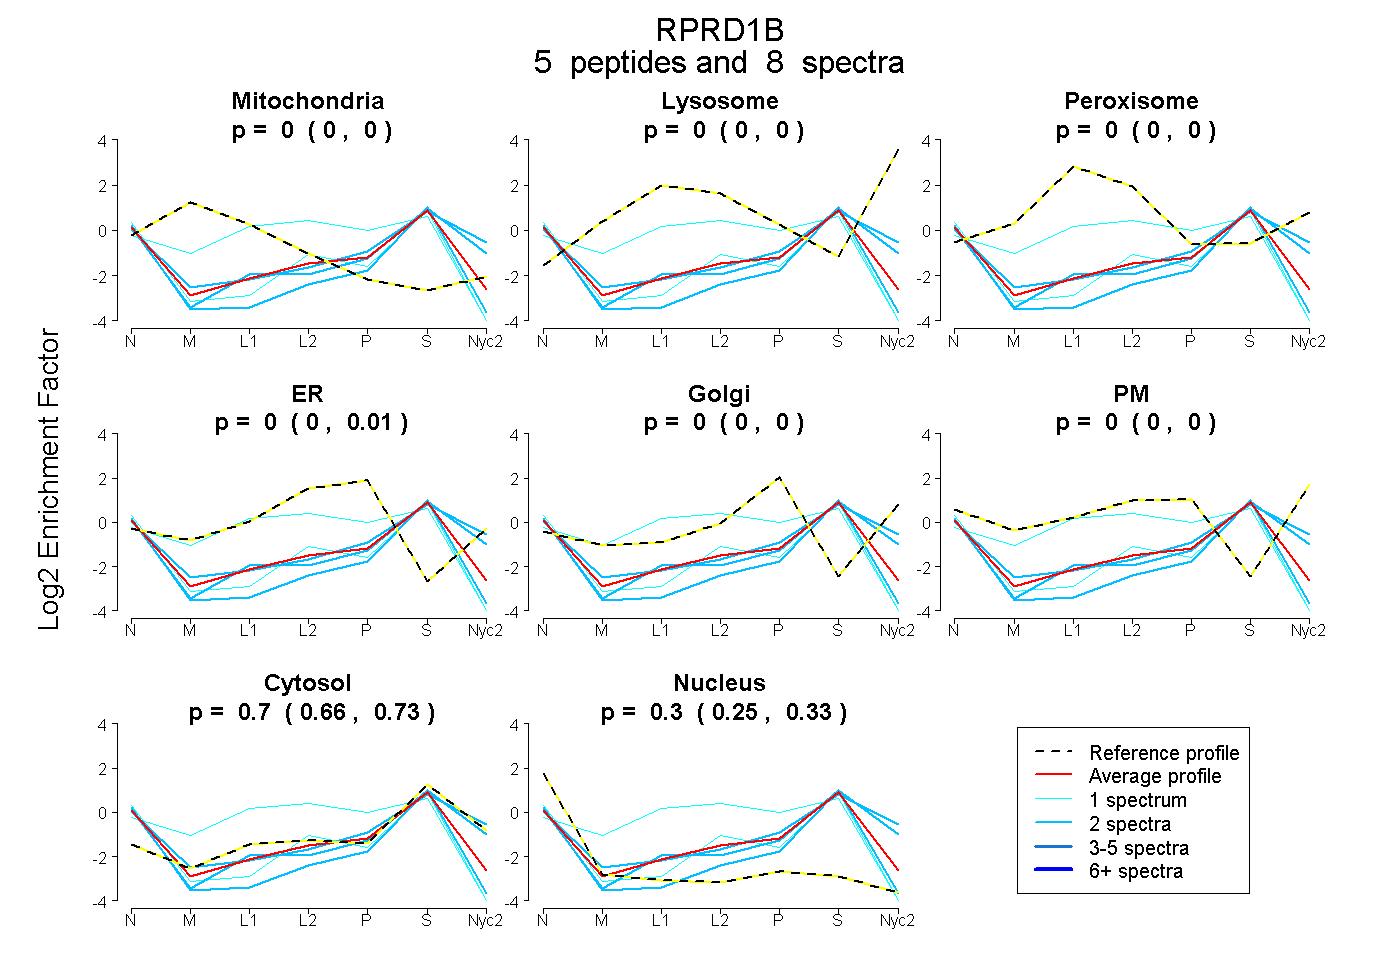
0.000 | 0.000
0.000 | 0.000
0.000 | 0.000
0.000 | 0.006
0.000 | 0.000
0.000 | 0.000
0.664 | 0.734
0.253 | 0.330
3peptides
spectra
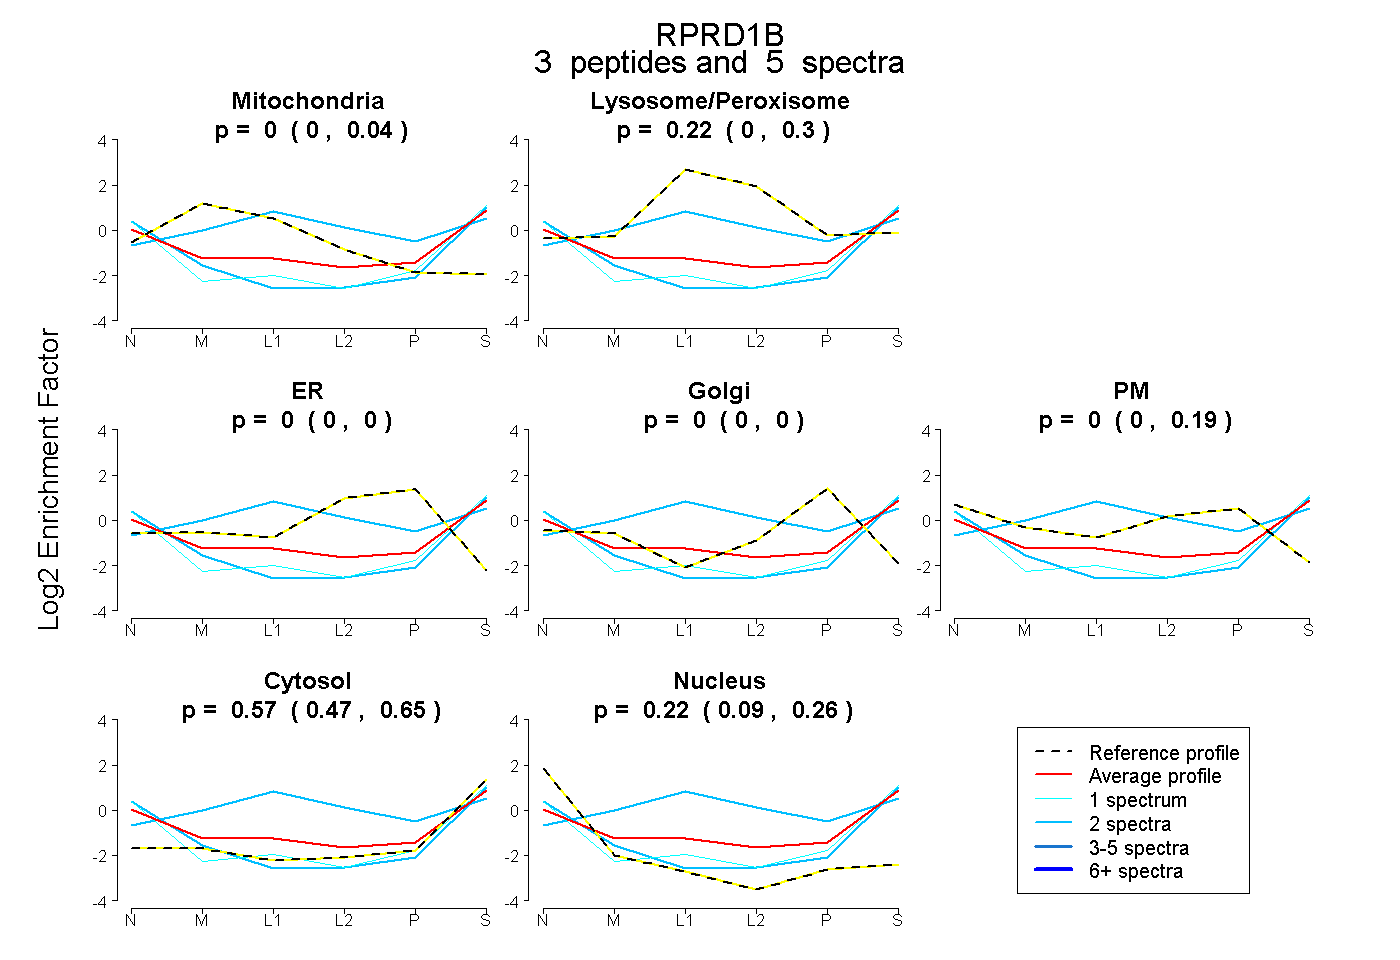
0.000 | 0.038
0.000 | 0.305
0.000 | 0.000
0.000 | 0.000
0.000 | 0.195
0.472 | 0.652
0.086 | 0.261
1peptide
spectra
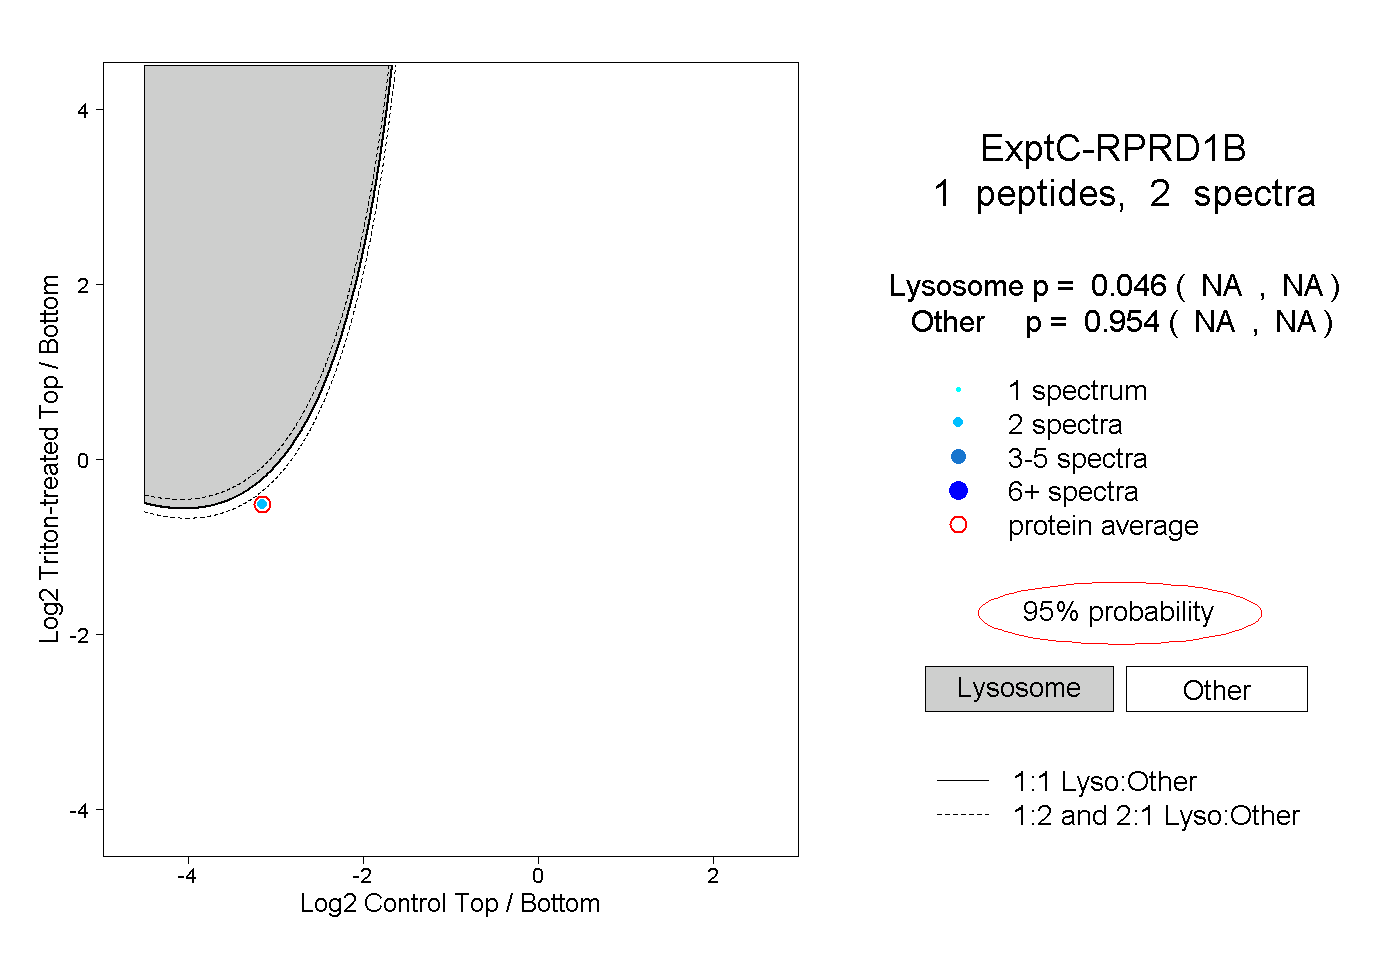
NA | NA
NA | NA