 5
5peptides
spectra
0.000 | 0.000
0.000 | 0.000
0.000 | 0.000
0.000 | 0.006
0.000 | 0.000
0.000 | 0.000
0.664 | 0.734
0.253 | 0.330
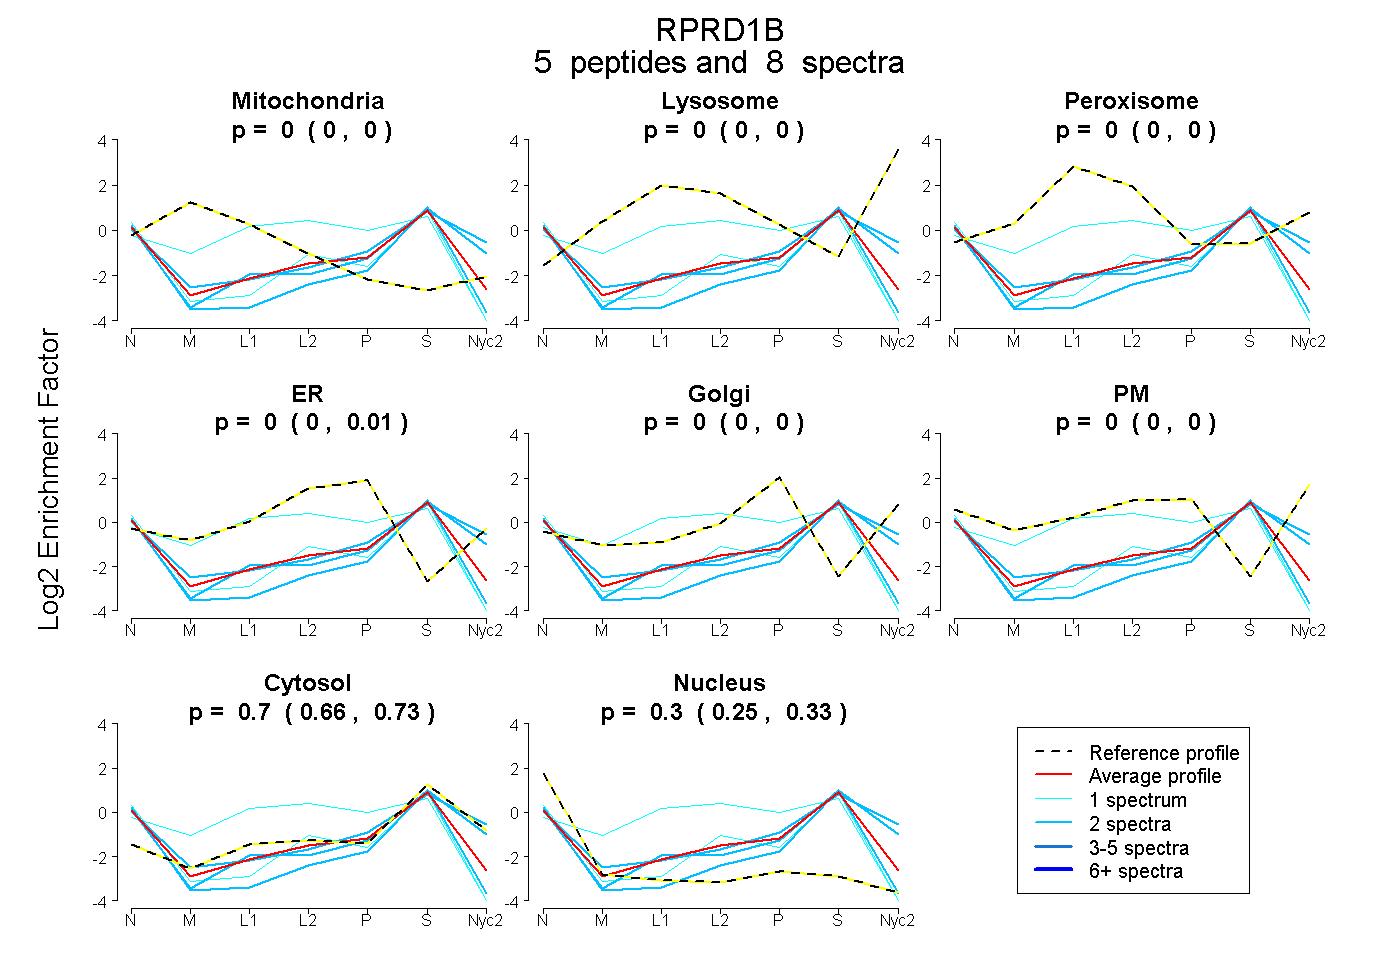
| Plot | Mito | Lyso | Perox | ER | Golgi | PM | Cytosol | Nucleus | |||||
| Expt A |
5 peptides |
8 spectra |
|
0.000 0.000 | 0.000 |
0.000 0.000 | 0.000 |
0.000 0.000 | 0.000 |
0.000 0.000 | 0.006 |
0.000 0.000 | 0.000 |
0.000 0.000 | 0.000 |
0.704 0.664 | 0.734 |
0.296 0.253 | 0.330 |
| 2 spectra, SVYGGEFIQQLK | 0.000 | 0.000 | 0.000 | 0.000 | 0.076 | 0.027 | 0.751 | 0.146 | ||
| 2 spectra, EFESVLVDAFSHVAR | 0.000 | 0.000 | 0.000 | 0.000 | 0.000 | 0.000 | 0.530 | 0.470 | ||
| 1 spectrum, ALQDLENAASGDATVR | 0.203 | 0.000 | 0.077 | 0.222 | 0.000 | 0.000 | 0.436 | 0.062 | ||
| 2 spectra, EVLSEK | 0.000 | 0.000 | 0.000 | 0.000 | 0.000 | 0.000 | 0.795 | 0.205 | ||
| 1 spectrum, EADEGCK | 0.000 | 0.000 | 0.000 | 0.000 | 0.000 | 0.000 | 0.574 | 0.426 |
| Plot | Mito | Lyso or Perox | ER | Golgi | PM | Cytosol | Nucleus | ||||||
| Expt B |
3 peptides |
5 spectra |
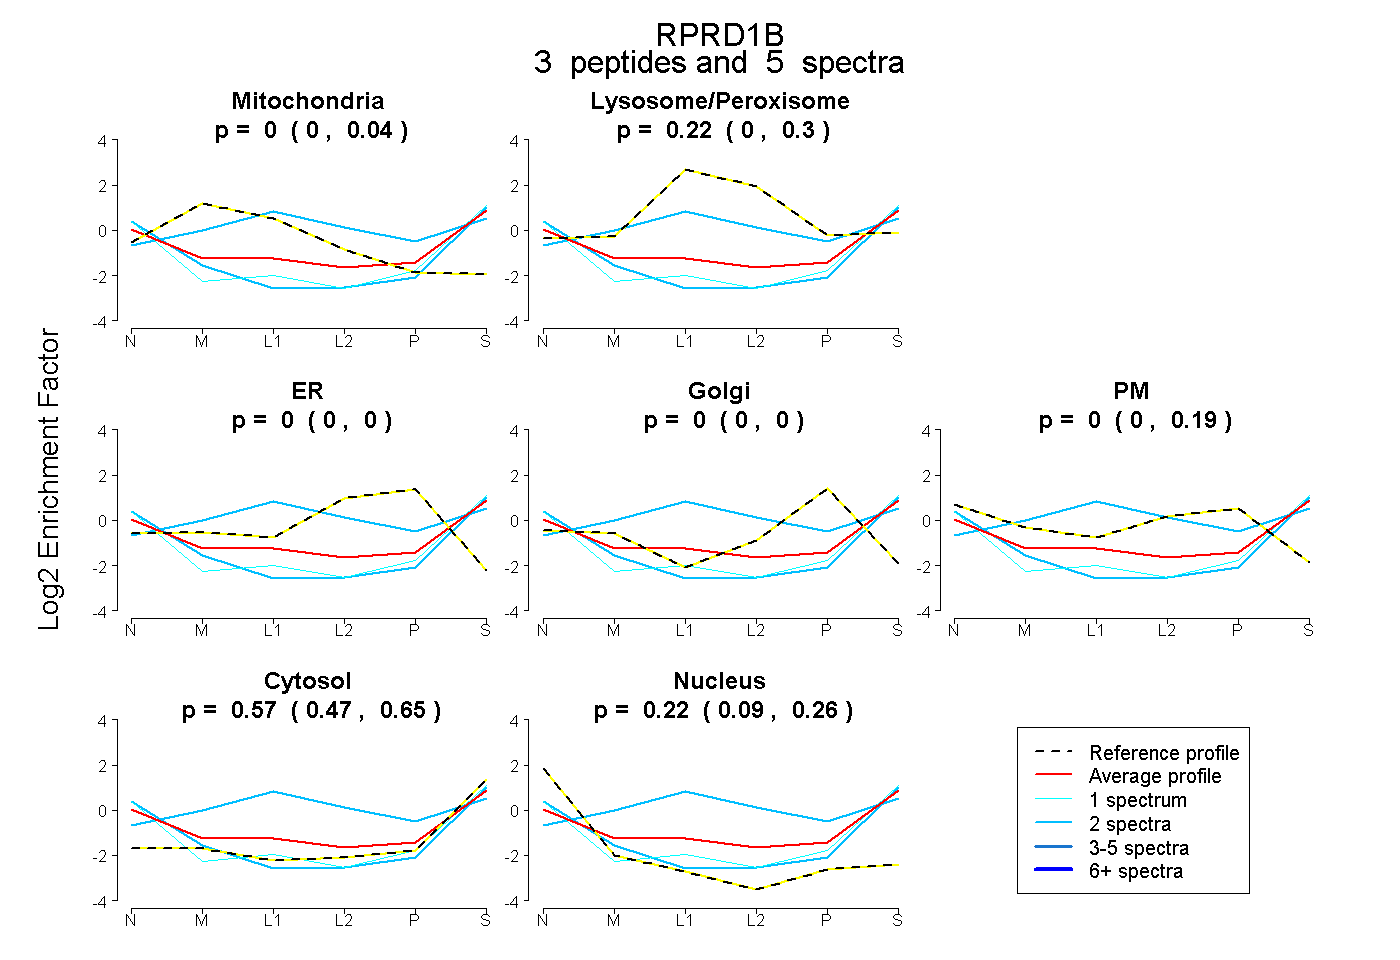 |
0.000 0.000 | 0.038 |
0.219 0.000 | 0.305 |
0.000 0.000 | 0.000 |
0.000 0.000 | 0.000 |
0.000 0.000 | 0.195 |
0.566 0.472 | 0.652 |
0.215 0.086 | 0.261 |
|||
| Plot | Lyso | Other | |||||||||||
| Expt C |
1 peptide |
2 spectra |
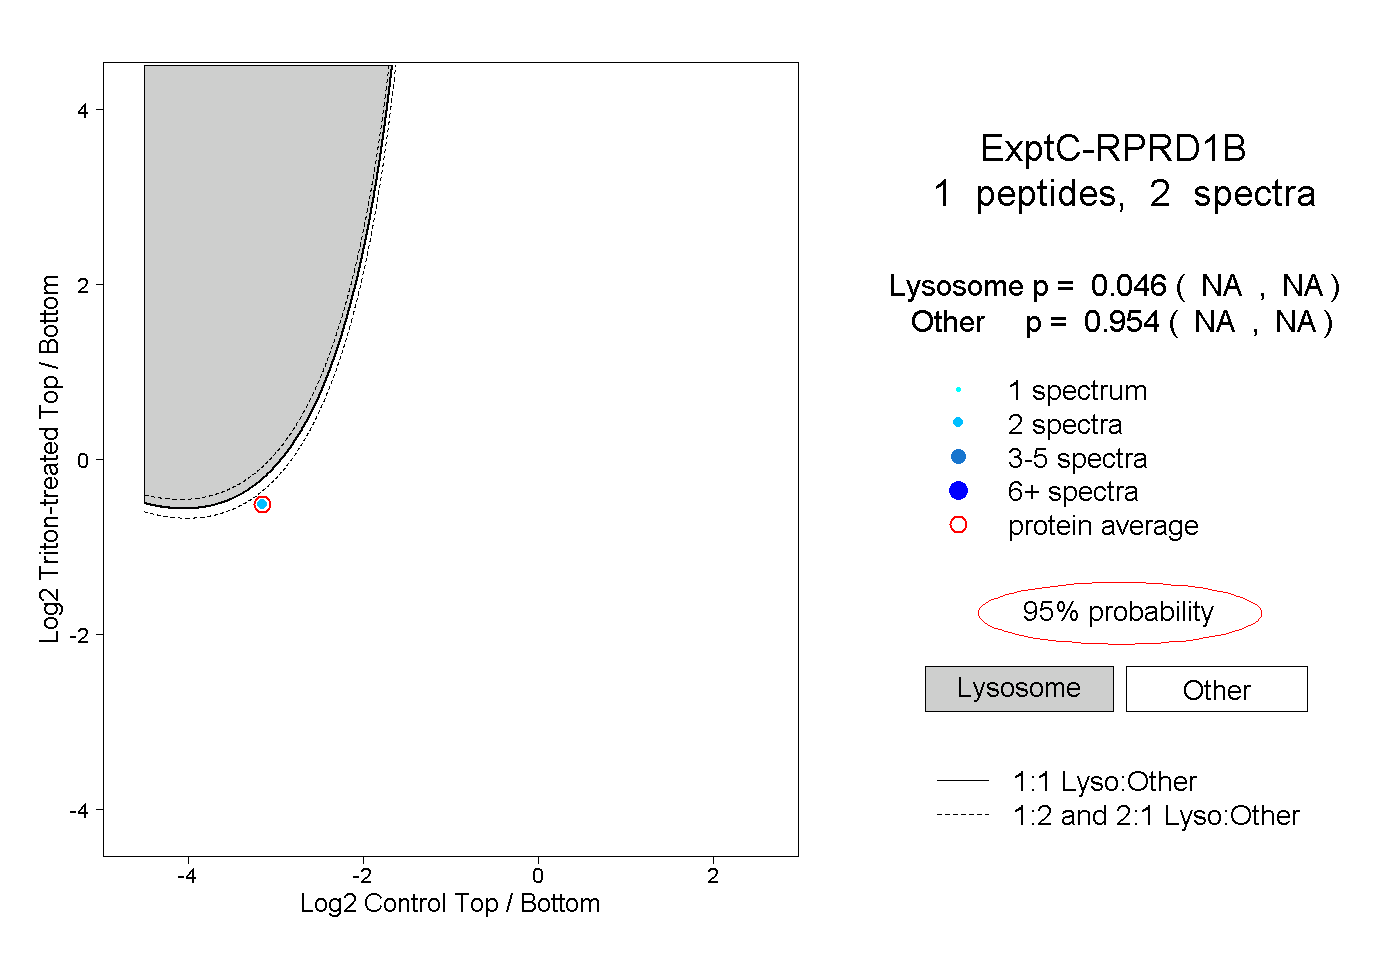 |
0.046 NA | NA |
0.954 NA | NA |