 7
7peptides
spectra
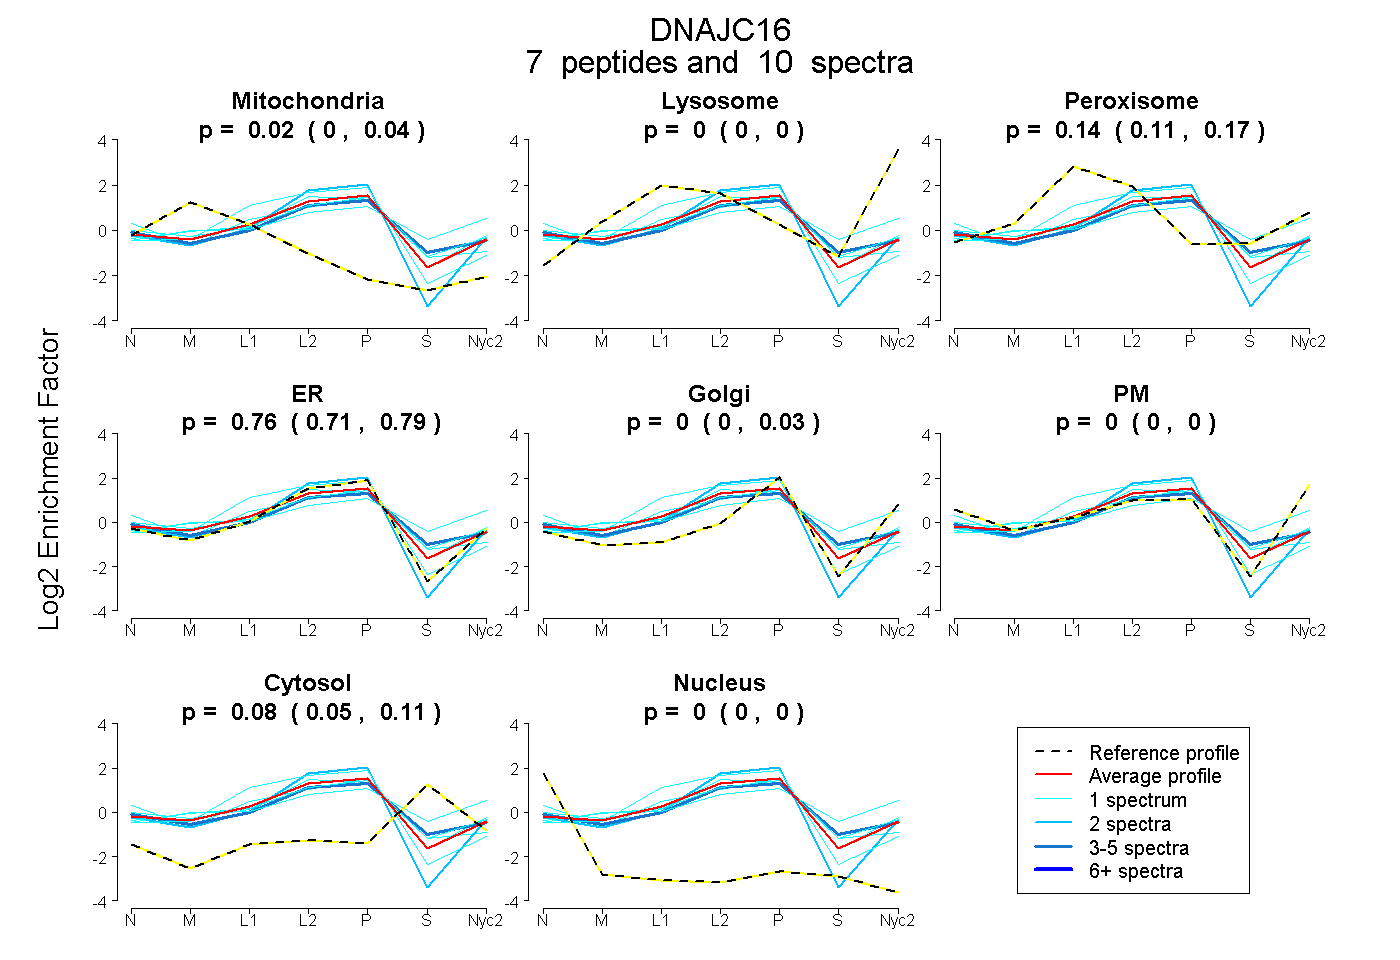
0.000 | 0.041
0.000 | 0.000
0.108 | 0.166
0.714 | 0.789
0.000 | 0.031
0.000 | 0.000
0.048 | 0.105
0.000 | 0.000
1peptide
spectrum
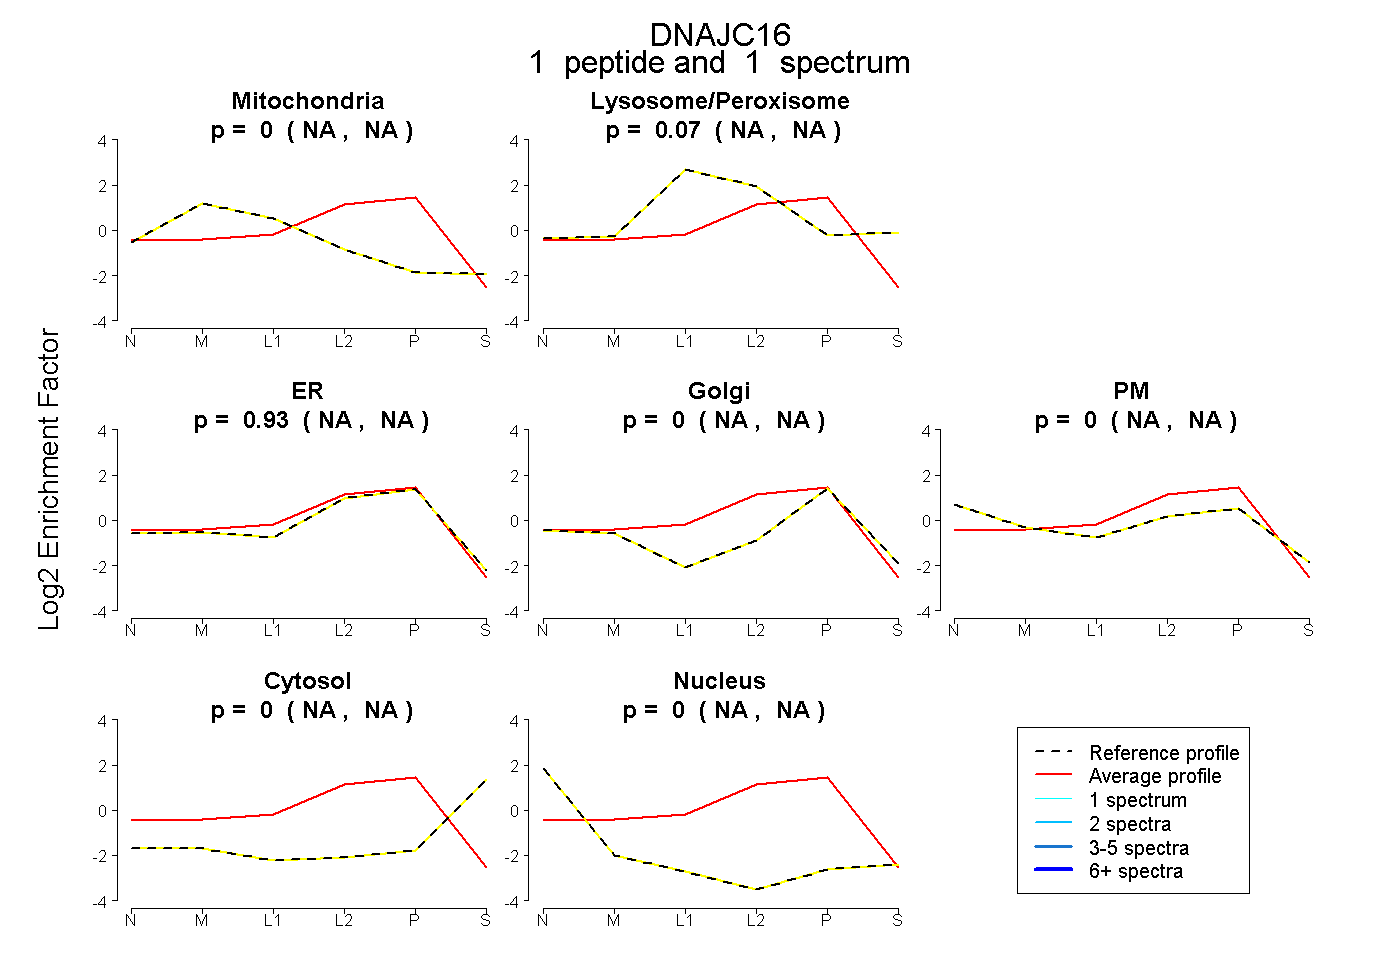
NA | NA
NA | NA
NA | NA
NA | NA
NA | NA
NA | NA
NA | NA
6peptides
spectra
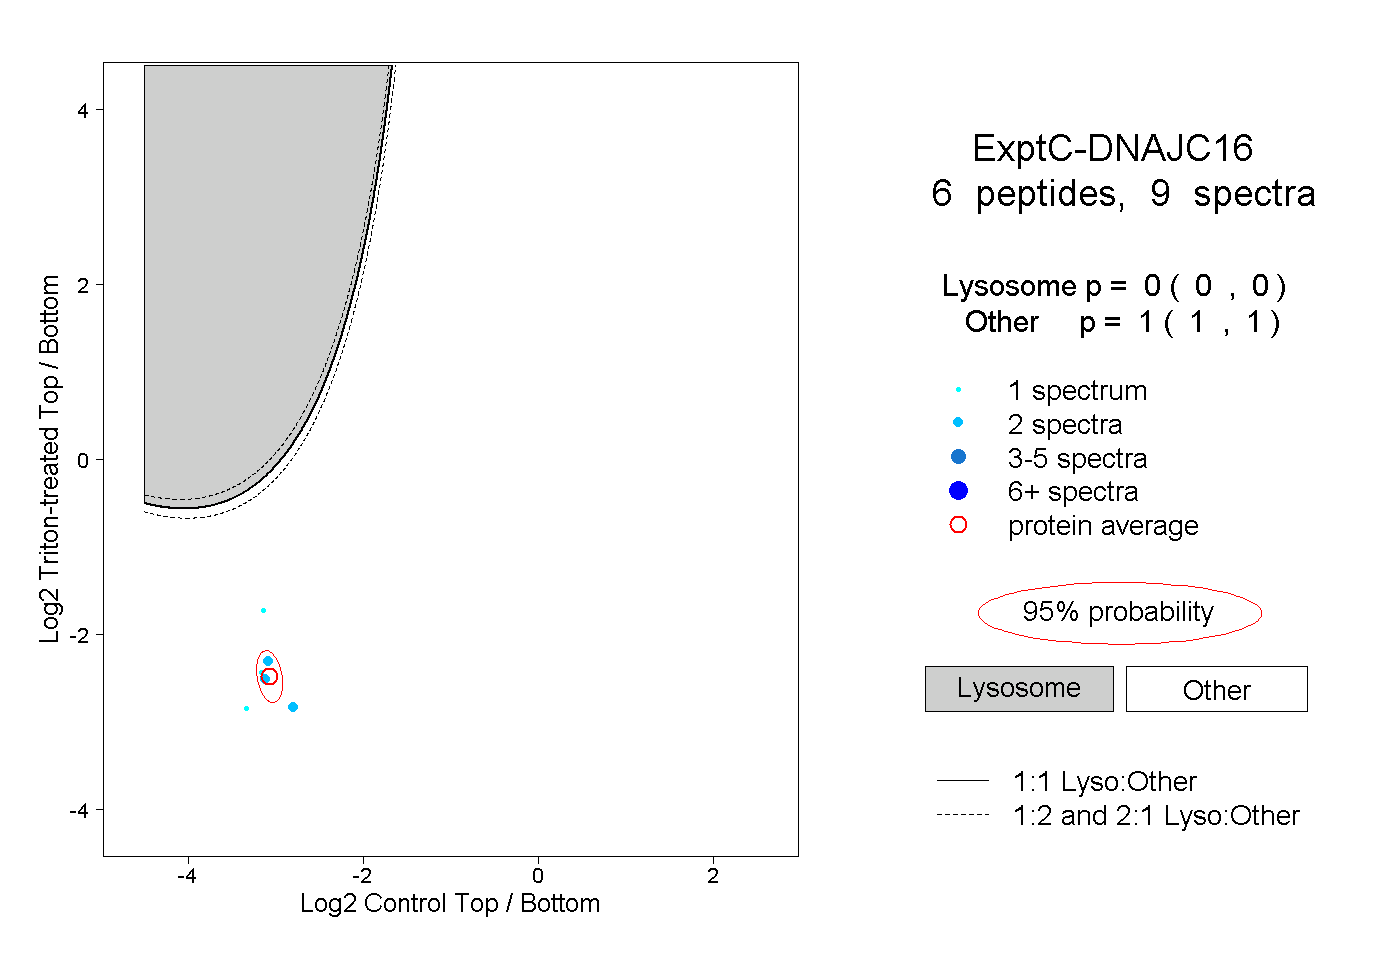
0.000 | 0.000
1.000 | 1.000