 7
7peptides
spectra
0.000 | 0.041
0.000 | 0.000
0.108 | 0.166
0.714 | 0.789
0.000 | 0.031
0.000 | 0.000
0.048 | 0.105
0.000 | 0.000
| Plot | Mito | Lyso | Perox | ER | Golgi | PM | Cytosol | Nucleus | |||||
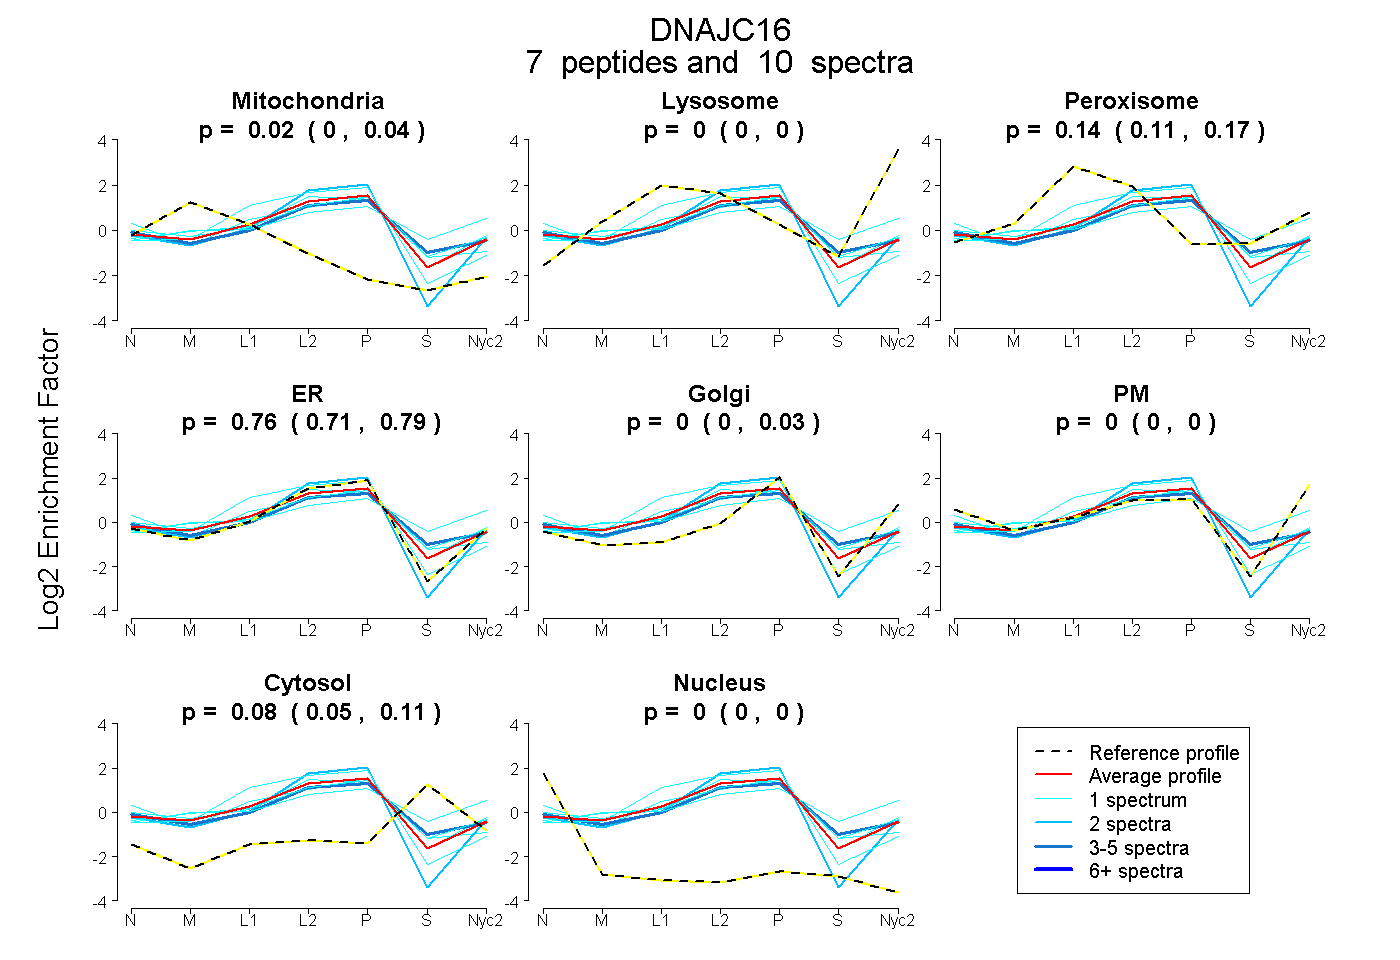
| Expt A |
7 peptides |
10 spectra |
|
0.016 0.000 | 0.041 |
0.000 0.000 | 0.000 |
0.139 0.108 | 0.166 |
0.763 0.714 | 0.789 |
0.000 0.000 | 0.031 |
0.000 0.000 | 0.000 |
0.082 0.048 | 0.105 |
0.000 0.000 | 0.000 |
| 1 spectrum, TLEDPWTGSESDK | 0.000 | 0.023 | 0.360 | 0.024 | 0.450 | 0.000 | 0.143 | 0.000 | ||
| 1 spectrum, EVVQELEGLGVGIGVVHAGYER | 0.000 | 0.000 | 0.176 | 0.618 | 0.056 | 0.071 | 0.046 | 0.033 | ||
| 3 spectra, GVEEMTR | 0.000 | 0.000 | 0.140 | 0.666 | 0.000 | 0.000 | 0.194 | 0.000 | ||
| 2 spectra, EWHPDK | 0.000 | 0.000 | 0.000 | 1.000 | 0.000 | 0.000 | 0.000 | 0.000 | ||
| 1 spectrum, VLGVSR | 0.027 | 0.000 | 0.142 | 0.831 | 0.000 | 0.000 | 0.000 | 0.000 | ||
| 1 spectrum, AYEILSNEEK | 0.039 | 0.000 | 0.144 | 0.704 | 0.000 | 0.000 | 0.112 | 0.000 | ||
| 1 spectrum, KPYLIK | 0.016 | 0.000 | 0.199 | 0.591 | 0.080 | 0.000 | 0.113 | 0.000 |
| Plot | Mito | Lyso or Perox | ER | Golgi | PM | Cytosol | Nucleus | ||||||
| Expt B |
1 peptide |
1 spectrum |
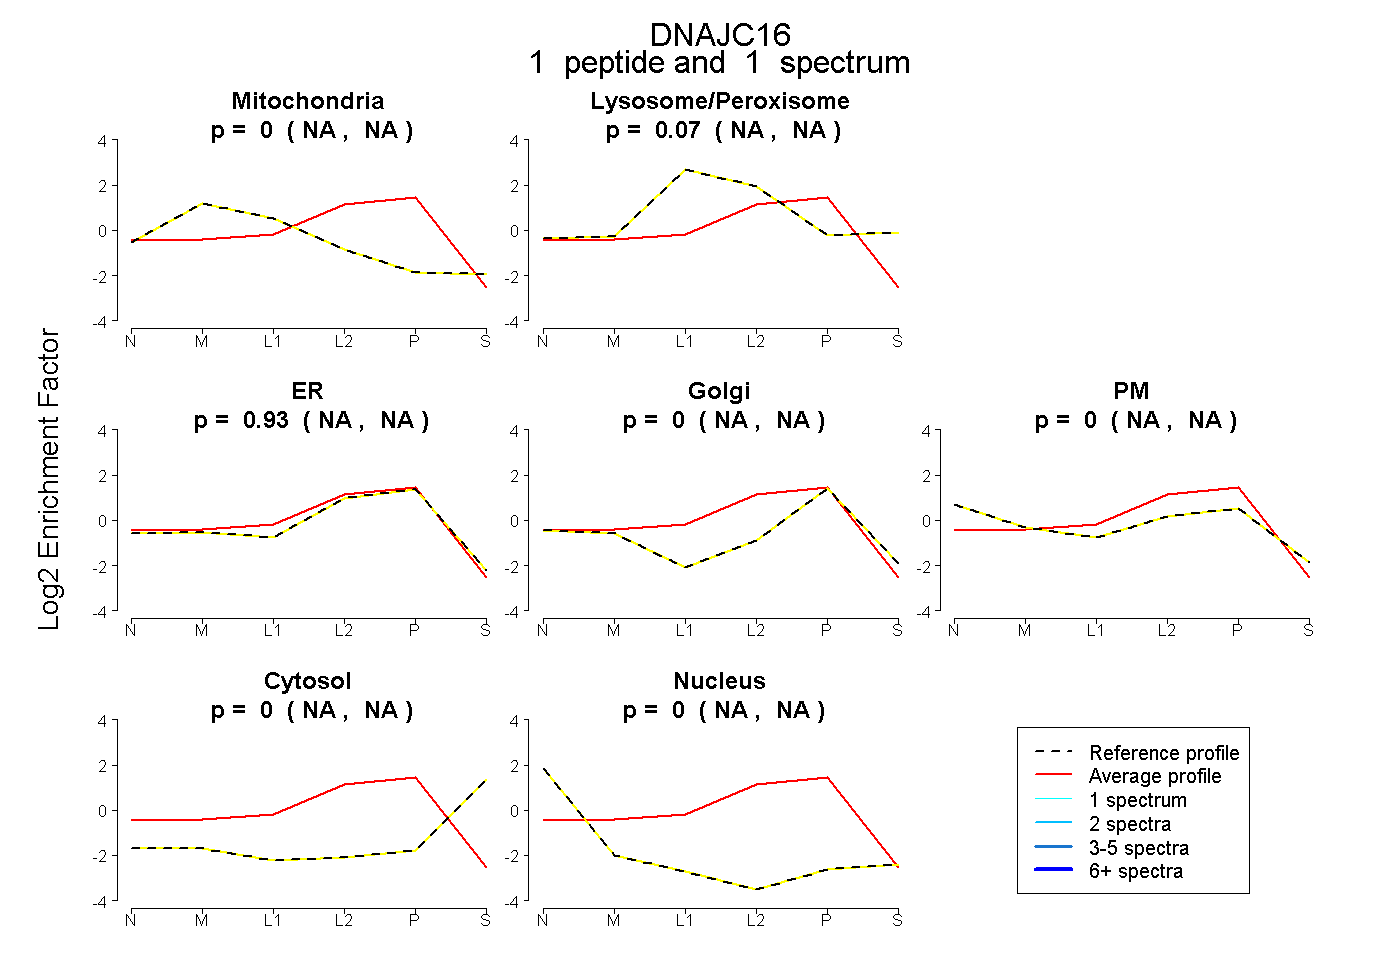 |
0.000 NA | NA |
0.071 NA | NA |
0.929 NA | NA |
0.000 NA | NA |
0.000 NA | NA |
0.000 NA | NA |
0.000 NA | NA |
|||
| Plot | Lyso | Other | |||||||||||
| Expt C |
6 peptides |
9 spectra |
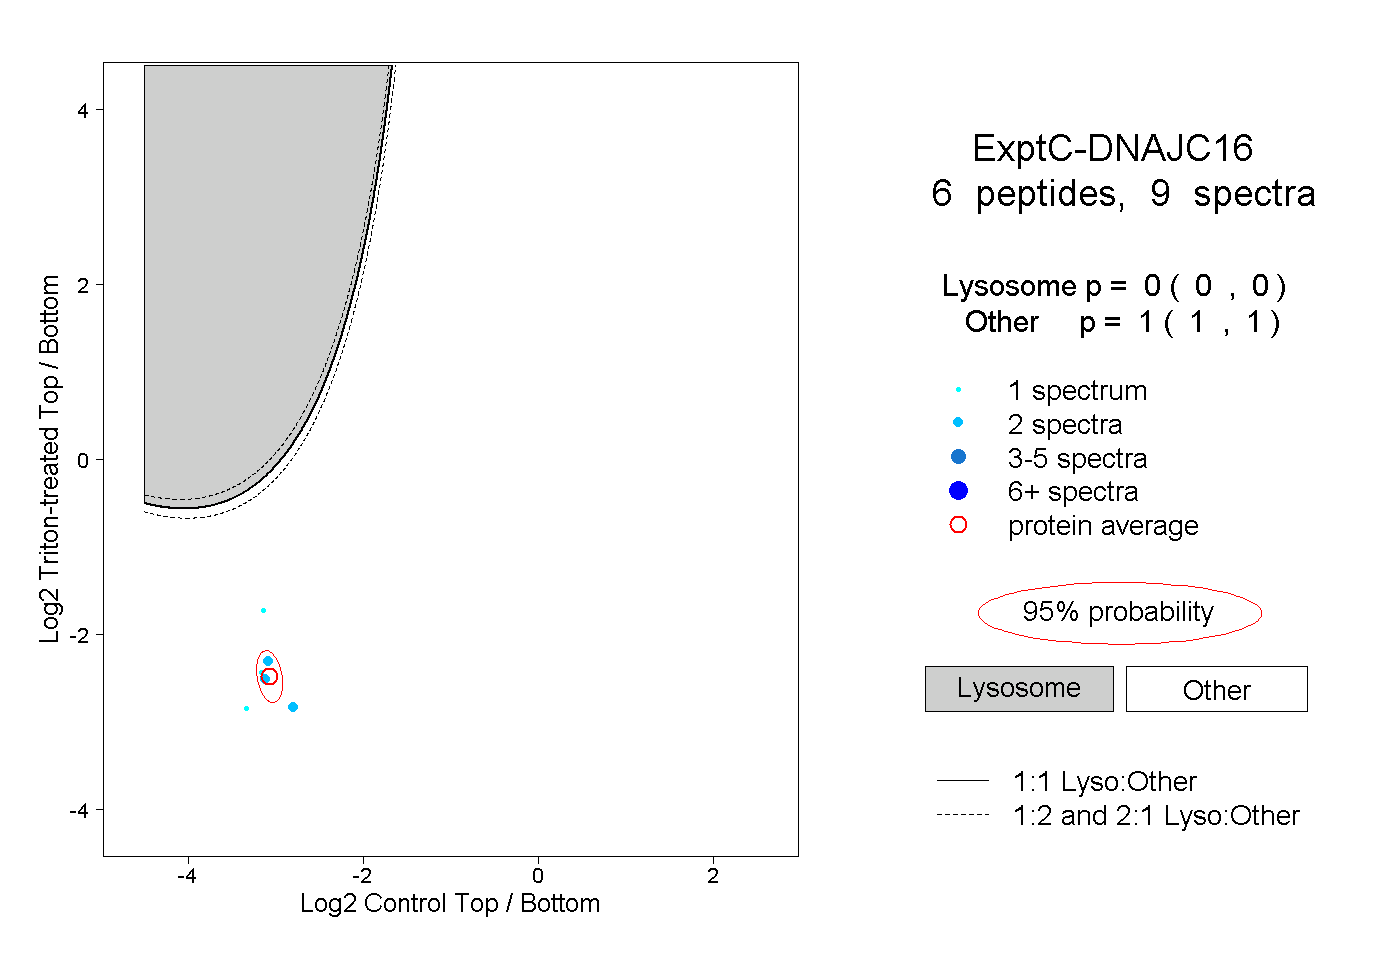 |
0.000 0.000 | 0.000 |
1.000 1.000 | 1.000 |