 7
7peptides
spectra
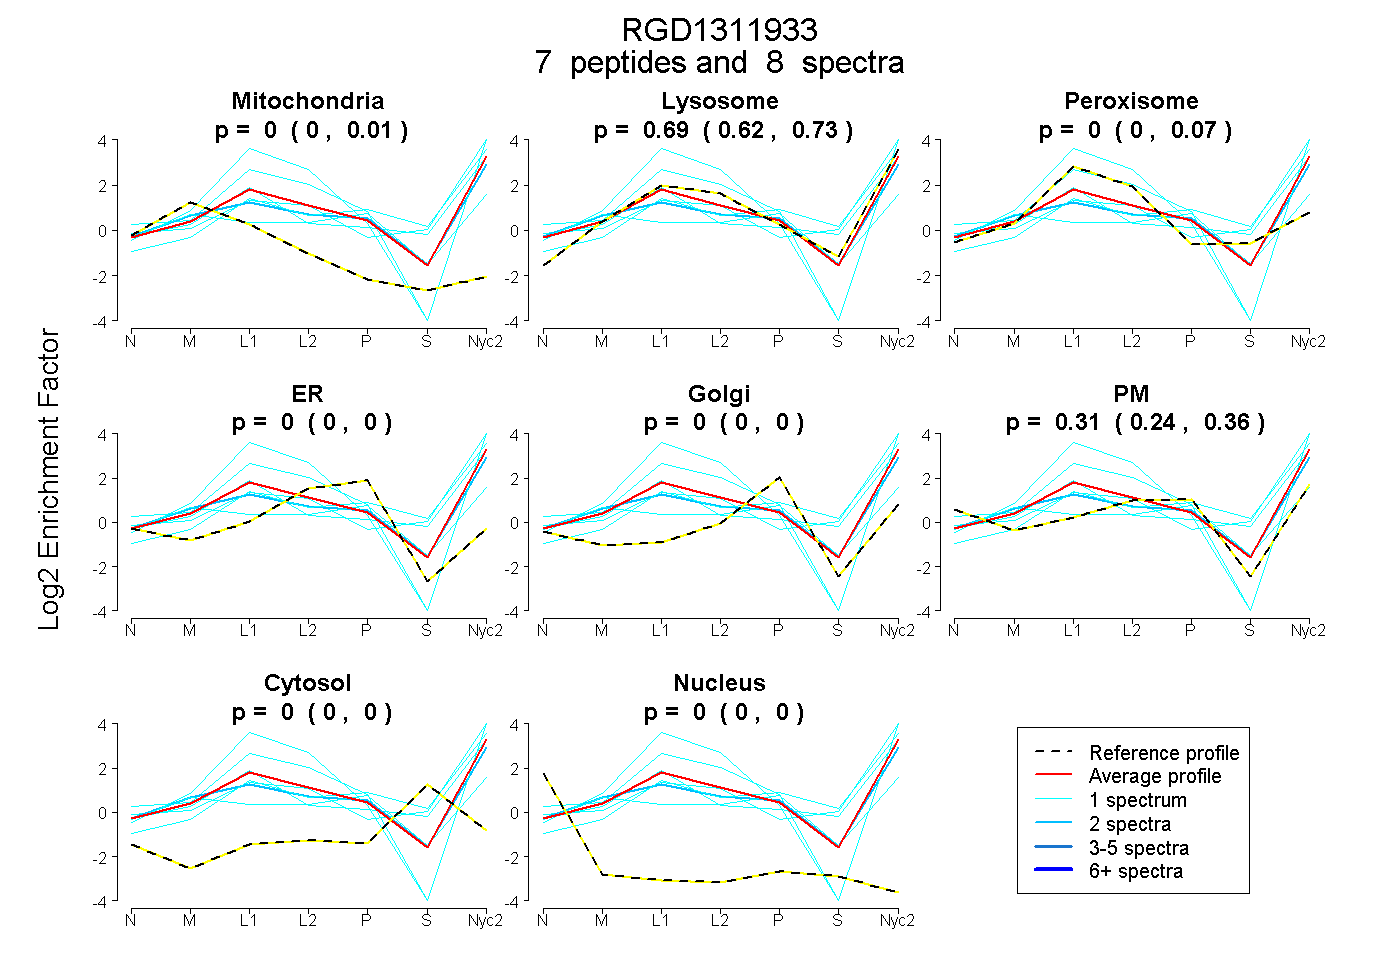
0.000 | 0.008
0.615 | 0.726
0.000 | 0.070
0.000 | 0.000
0.000 | 0.000
0.242 | 0.362
0.000 | 0.000
0.000 | 0.000
4peptides
spectra
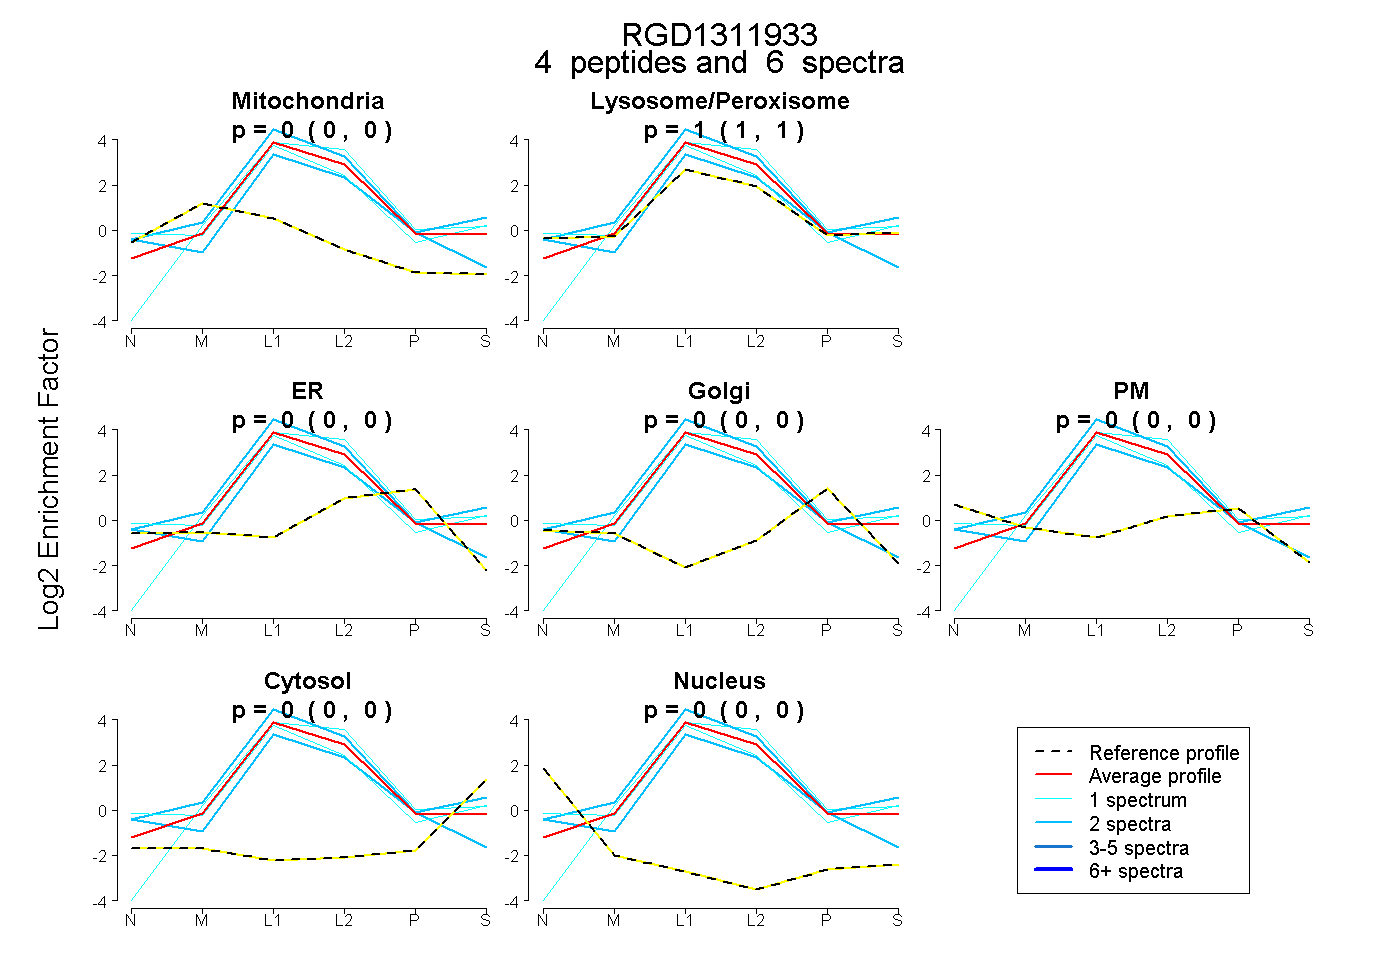
0.000 | 0.000
1.000 | 1.000
0.000 | 0.000
0.000 | 0.000
0.000 | 0.000
0.000 | 0.000
0.000 | 0.000
7peptides
spectra
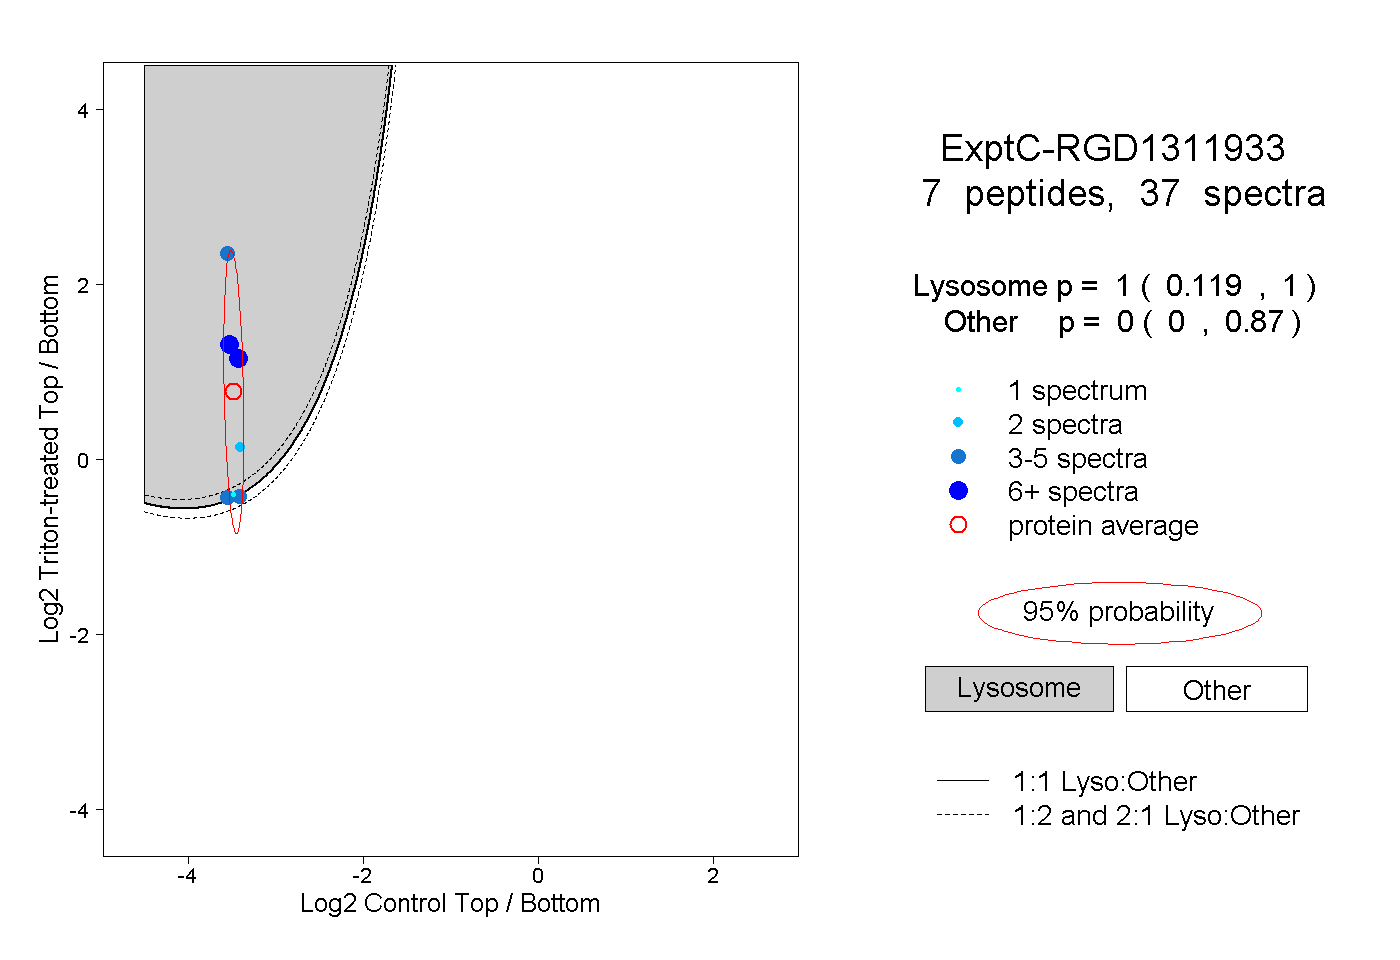
0.119 | 1.000
0.000 | 0.870
2peptides
spectra

0.091 | 0.997
0.003 | 0.907