 7
7peptides
spectra
0.000 | 0.008
0.615 | 0.726
0.000 | 0.070
0.000 | 0.000
0.000 | 0.000
0.242 | 0.362
0.000 | 0.000
0.000 | 0.000
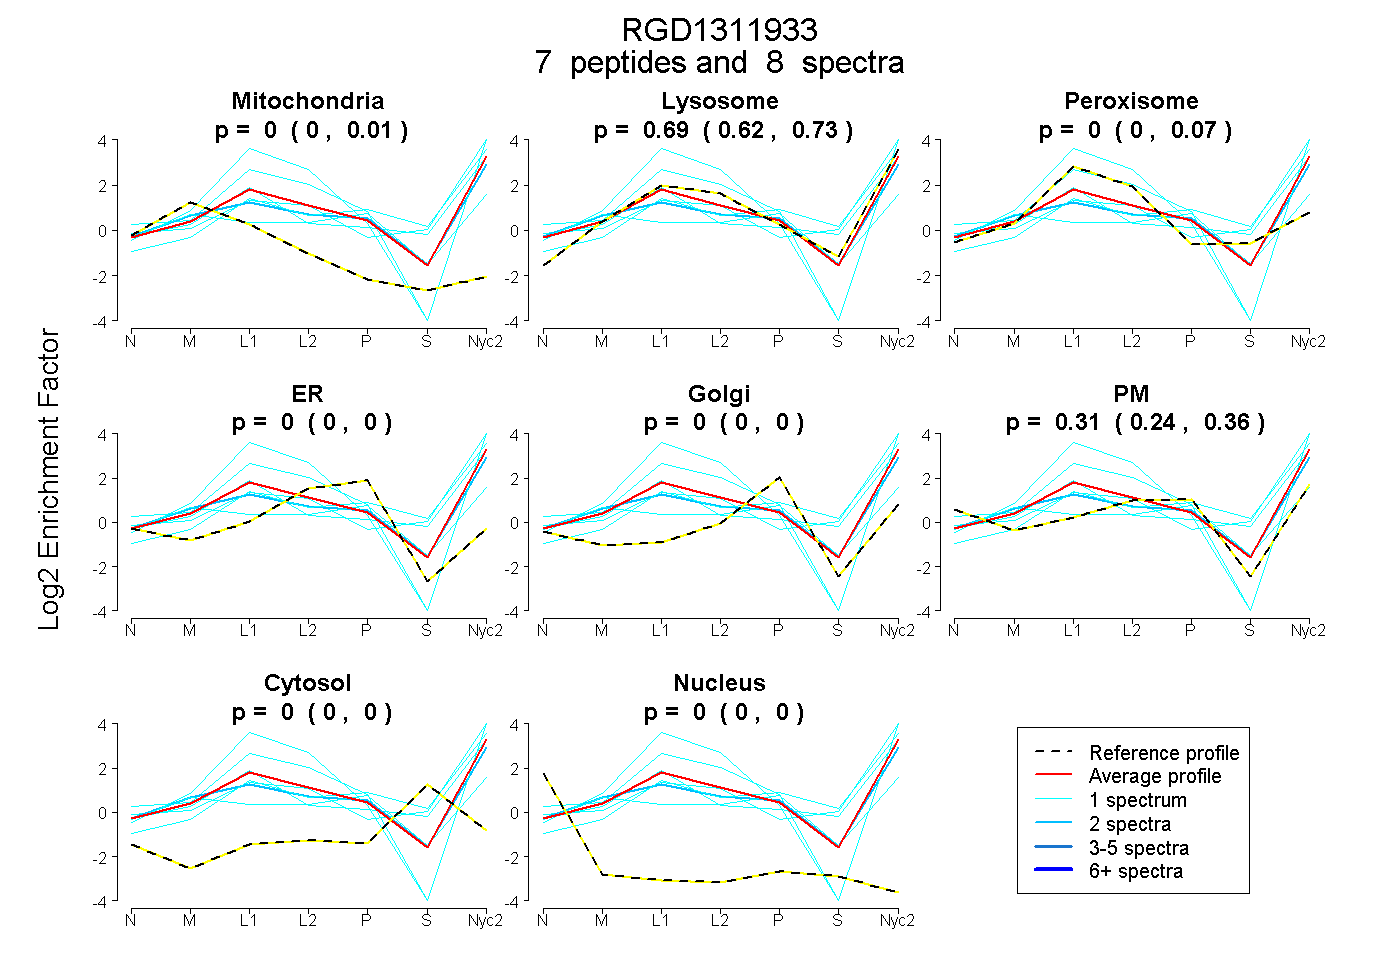
| Plot | Mito | Lyso | Perox | ER | Golgi | PM | Cytosol | Nucleus | |||||
| Expt A |
7 peptides |
8 spectra |
|
0.000 0.000 | 0.008 |
0.685 0.615 | 0.726 |
0.000 0.000 | 0.070 |
0.000 0.000 | 0.000 |
0.000 0.000 | 0.000 |
0.315 0.242 | 0.362 |
0.000 0.000 | 0.000 |
0.000 0.000 | 0.000 |
| 1 spectrum, LADPTGMTDCGK | 0.000 | 0.605 | 0.000 | 0.000 | 0.000 | 0.395 | 0.000 | 0.000 | ||
| 1 spectrum, AFEEFLGTSP | 0.000 | 0.758 | 0.053 | 0.000 | 0.000 | 0.066 | 0.123 | 0.000 | ||
| 2 spectra, LPTTLNR | 0.048 | 0.574 | 0.000 | 0.000 | 0.000 | 0.378 | 0.000 | 0.000 | ||
| 1 spectrum, LFGNTDR | 0.000 | 0.865 | 0.000 | 0.000 | 0.000 | 0.023 | 0.112 | 0.000 | ||
| 1 spectrum, LWDAHTSSLEYPTR | 0.174 | 0.359 | 0.000 | 0.000 | 0.257 | 0.210 | 0.000 | 0.000 | ||
| 1 spectrum, YVINPWVLTDR | 0.000 | 0.905 | 0.000 | 0.000 | 0.000 | 0.095 | 0.000 | 0.000 | ||
| 1 spectrum, VLDDTDITPFIPDFTPLQNK | 0.000 | 0.831 | 0.000 | 0.000 | 0.022 | 0.000 | 0.147 | 0.000 |
| Plot | Mito | Lyso or Perox | ER | Golgi | PM | Cytosol | Nucleus | ||||||
| Expt B |
4 peptides |
6 spectra |
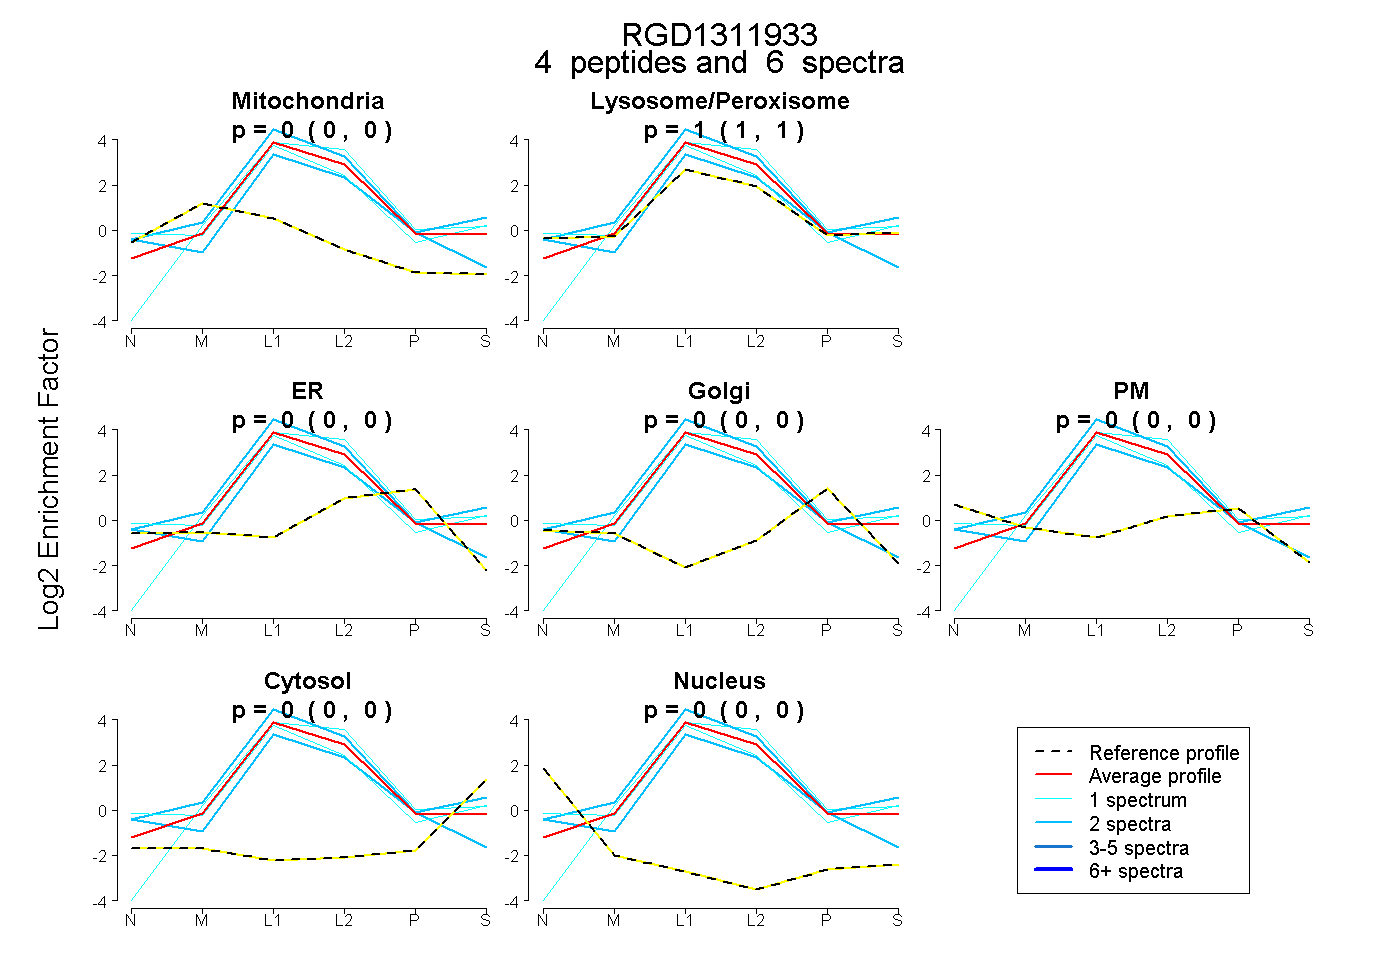 |
0.000 0.000 | 0.000 |
1.000 1.000 | 1.000 |
0.000 0.000 | 0.000 |
0.000 0.000 | 0.000 |
0.000 0.000 | 0.000 |
0.000 0.000 | 0.000 |
0.000 0.000 | 0.000 |
|||
| Plot | Lyso | Other | |||||||||||
| Expt C |
7 peptides |
37 spectra |
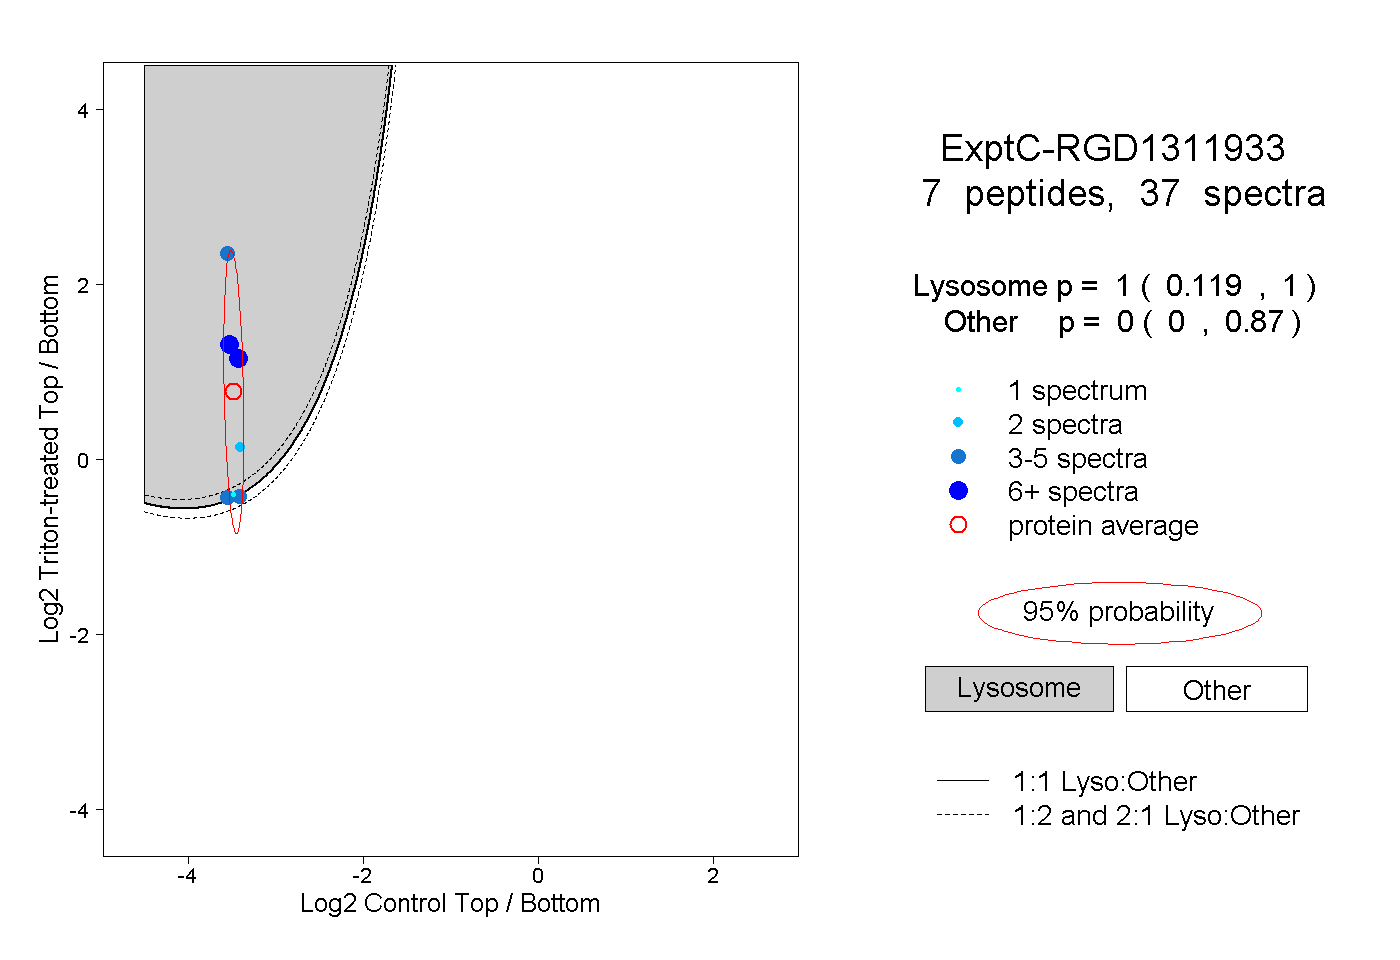 |
1.000 0.119 | 1.000 |
0.000 0.000 | 0.870 |
||||||||
| Plot | Lyso | Other | |||||||||||
| Expt D |
2 peptides |
6 spectra |
 |
0.852 0.091 | 0.997 |
0.148 0.003 | 0.907 |