 7
7peptides
spectra
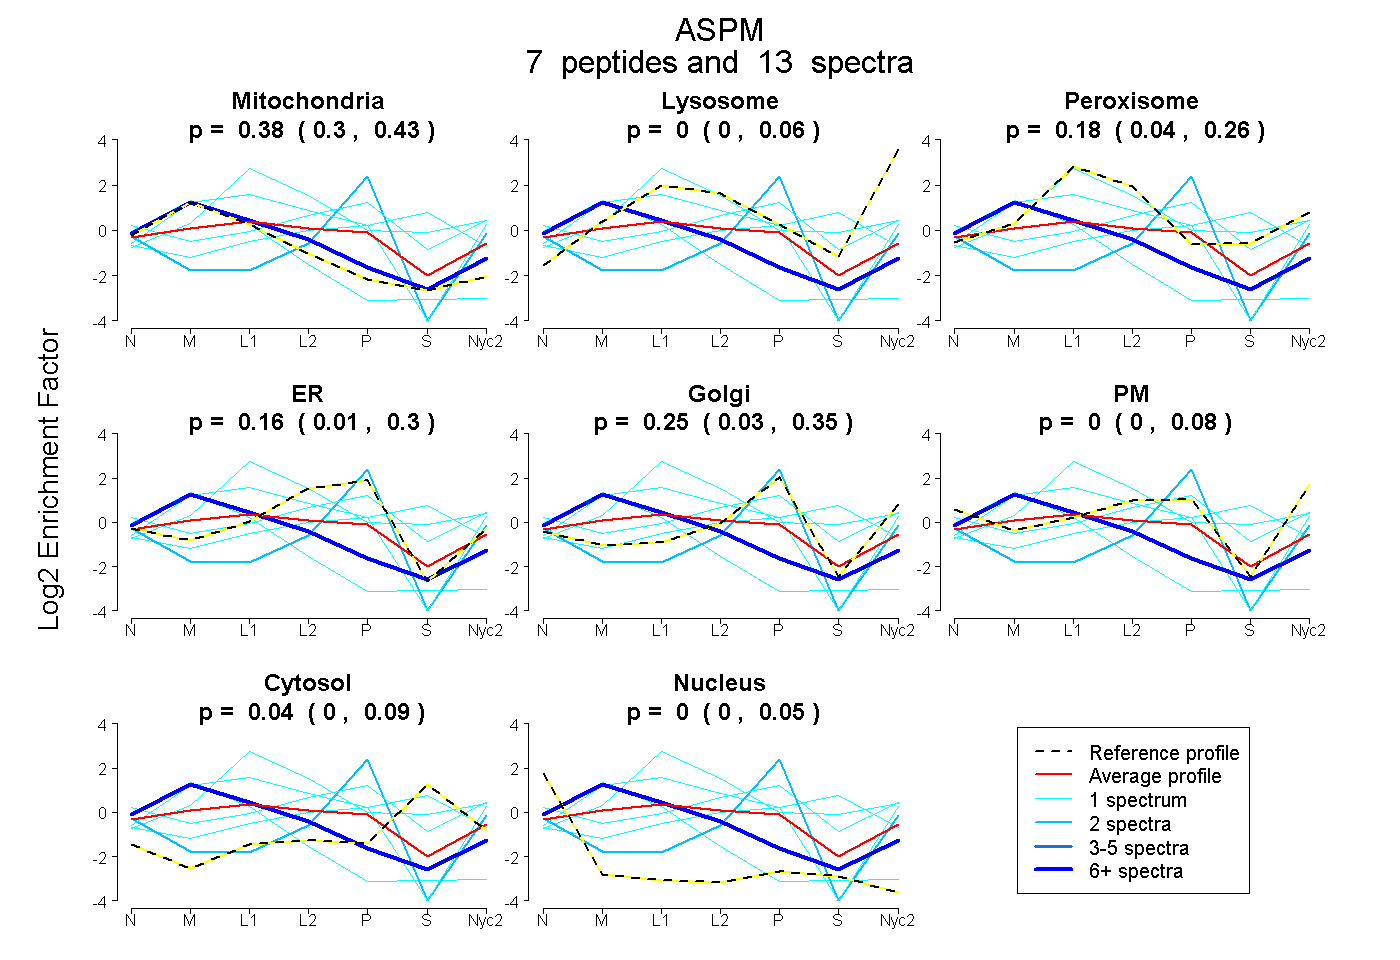
0.296 | 0.432
0.000 | 0.056
0.045 | 0.256
0.013 | 0.296
0.027 | 0.347
0.000 | 0.083
0.000 | 0.092
0.000 | 0.047
2peptides
spectra
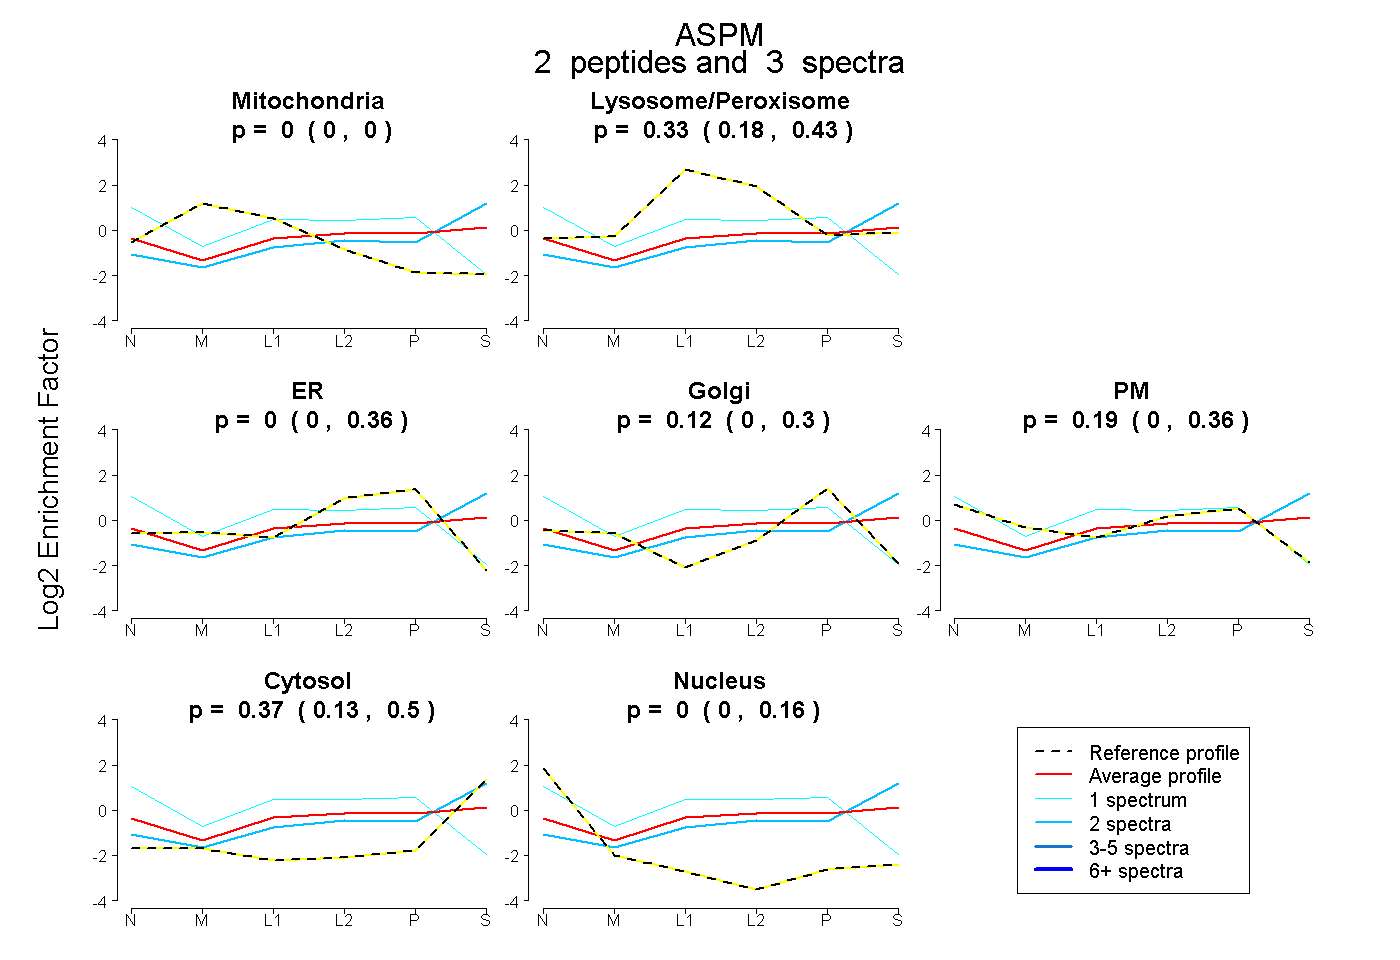
0.000 | 0.000
0.181 | 0.433
0.000 | 0.357
0.000 | 0.297
0.000 | 0.364
0.134 | 0.503
0.000 | 0.157
2peptides
spectra
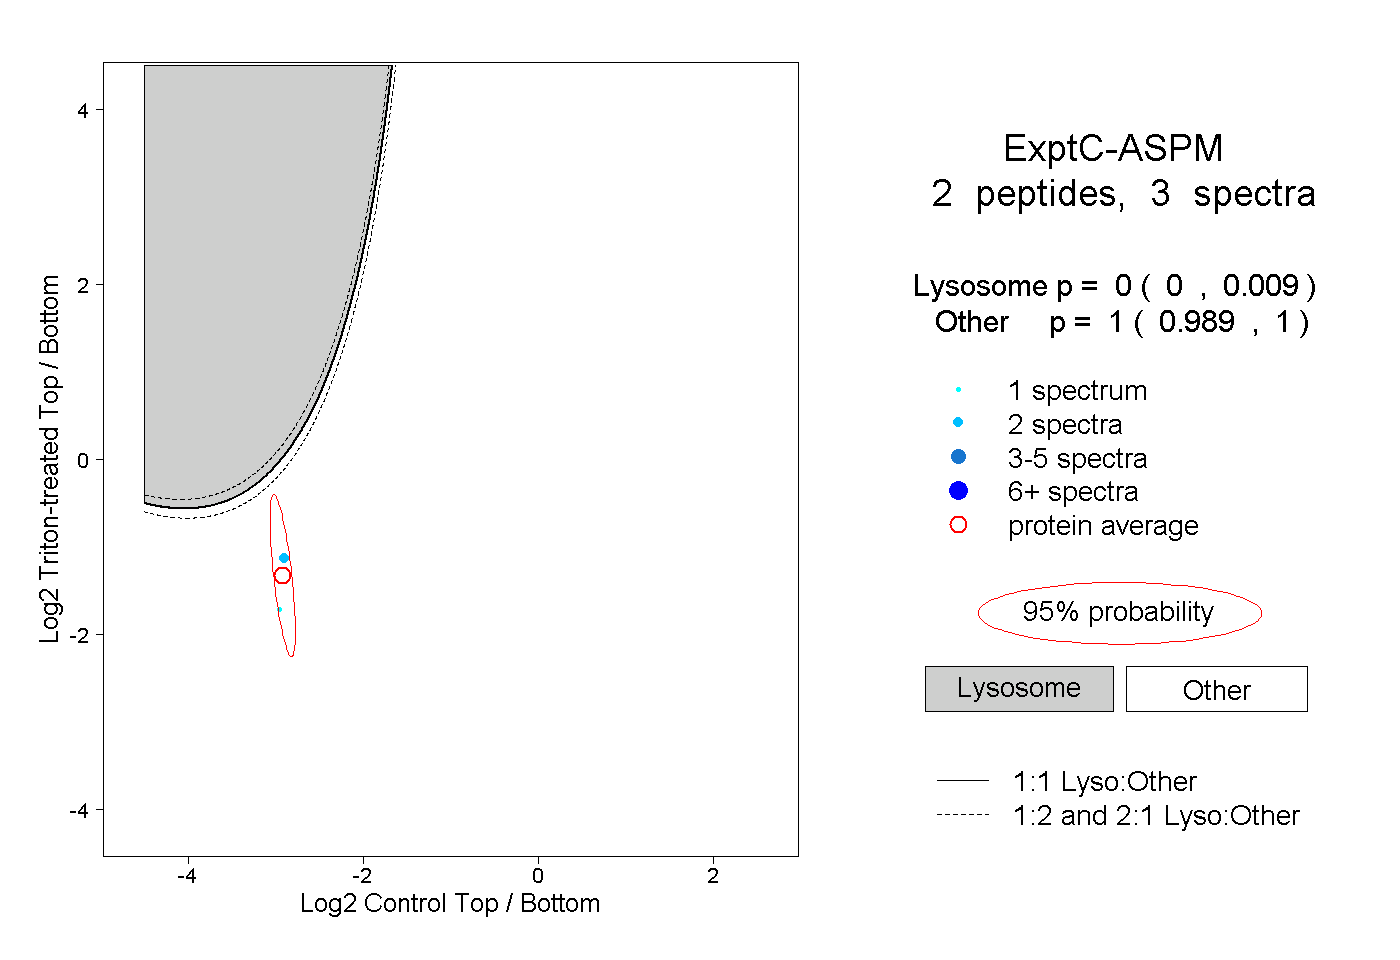
0.000 | 0.009
0.989 | 1.000
3peptides
spectra
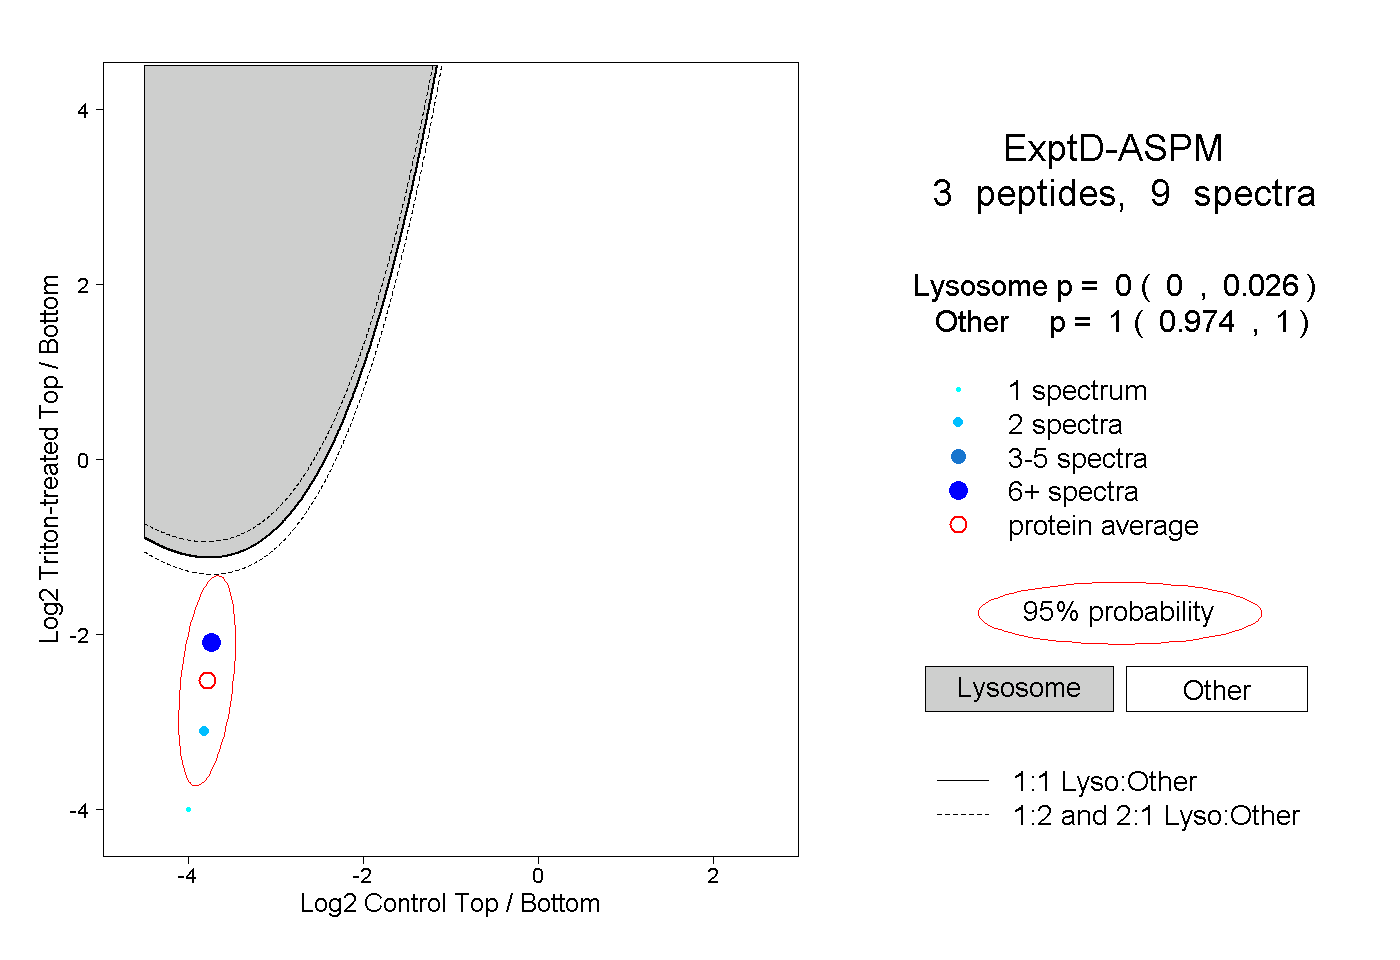
0.000 | 0.026
0.974 | 1.000