 7
7peptides
spectra
0.296 | 0.432
0.000 | 0.056
0.045 | 0.256
0.013 | 0.296
0.027 | 0.347
0.000 | 0.083
0.000 | 0.092
0.000 | 0.047
| Plot | Mito | Lyso | Perox | ER | Golgi | PM | Cytosol | Nucleus | |||||
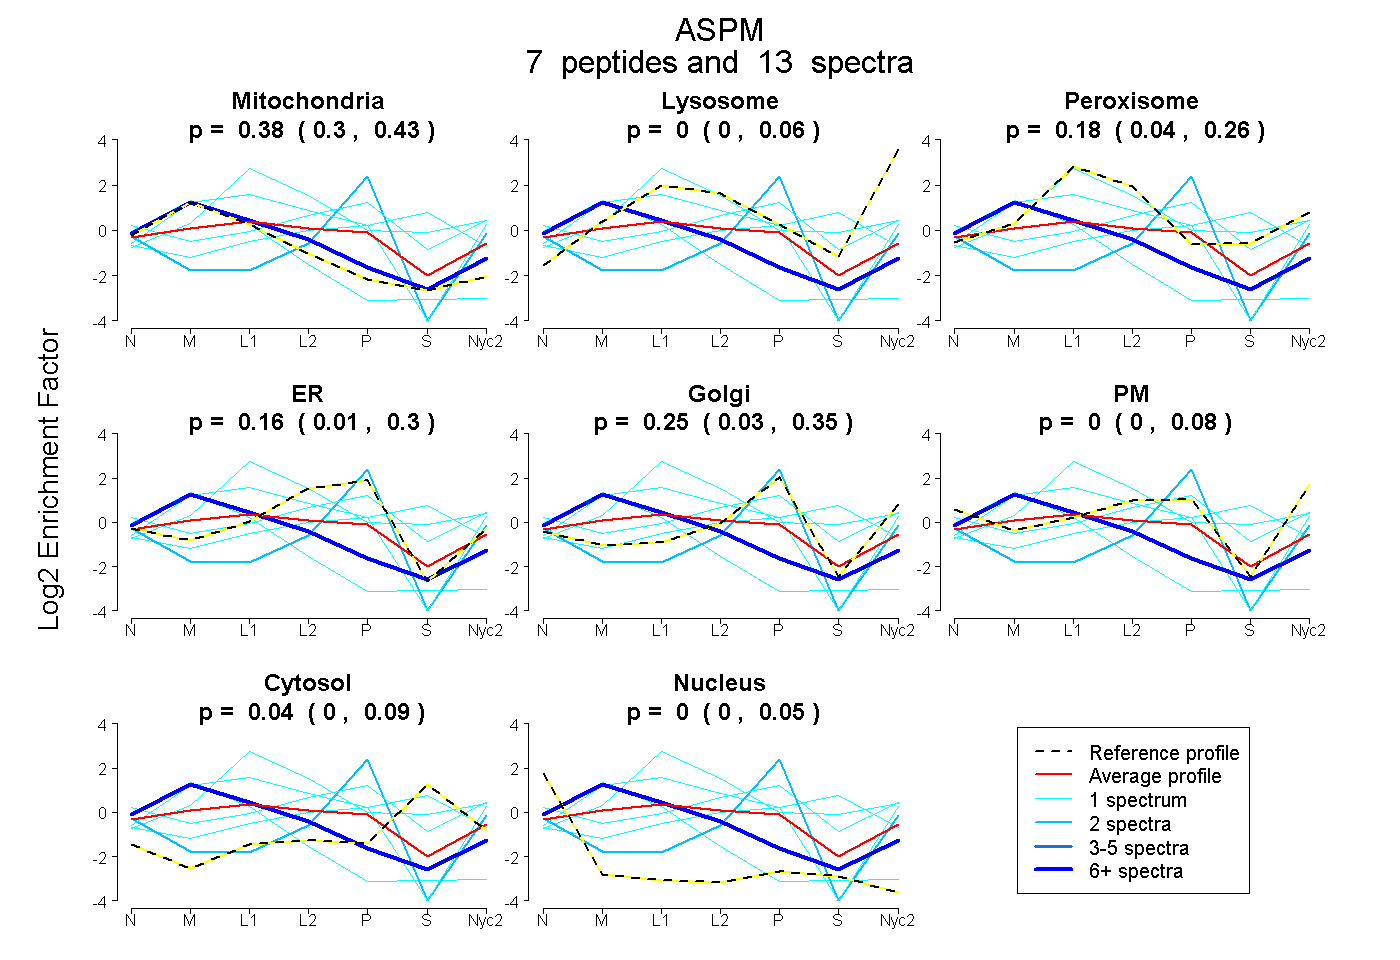
| Expt A |
7 peptides |
13 spectra |
|
0.381 0.296 | 0.432 |
0.000 0.000 | 0.056 |
0.178 0.045 | 0.256 |
0.157 0.013 | 0.296 |
0.246 0.027 | 0.347 |
0.000 0.000 | 0.083 |
0.038 0.000 | 0.092 |
0.000 0.000 | 0.047 |
| 2 spectra, EFLALR | 0.000 | 0.000 | 0.000 | 0.000 | 0.866 | 0.000 | 0.000 | 0.134 | ||
| 6 spectra, LQAHLR | 0.801 | 0.033 | 0.047 | 0.000 | 0.000 | 0.119 | 0.000 | 0.000 | ||
| 1 spectrum, AAAVFIQR | 0.000 | 0.000 | 0.919 | 0.023 | 0.000 | 0.000 | 0.058 | 0.000 | ||
| 1 spectrum, AAGQGFSASPNR | 0.916 | 0.000 | 0.000 | 0.000 | 0.000 | 0.000 | 0.000 | 0.084 | ||
| 1 spectrum, ILDIR | 0.372 | 0.284 | 0.000 | 0.335 | 0.000 | 0.009 | 0.000 | 0.000 | ||
| 1 spectrum, AAAIIIQR | 0.000 | 0.000 | 0.152 | 0.259 | 0.000 | 0.000 | 0.590 | 0.000 | ||
| 1 spectrum, HEELEK | 0.000 | 0.000 | 0.143 | 0.192 | 0.176 | 0.309 | 0.179 | 0.000 |
| Plot | Mito | Lyso or Perox | ER | Golgi | PM | Cytosol | Nucleus | ||||||
| Expt B |
2 peptides |
3 spectra |
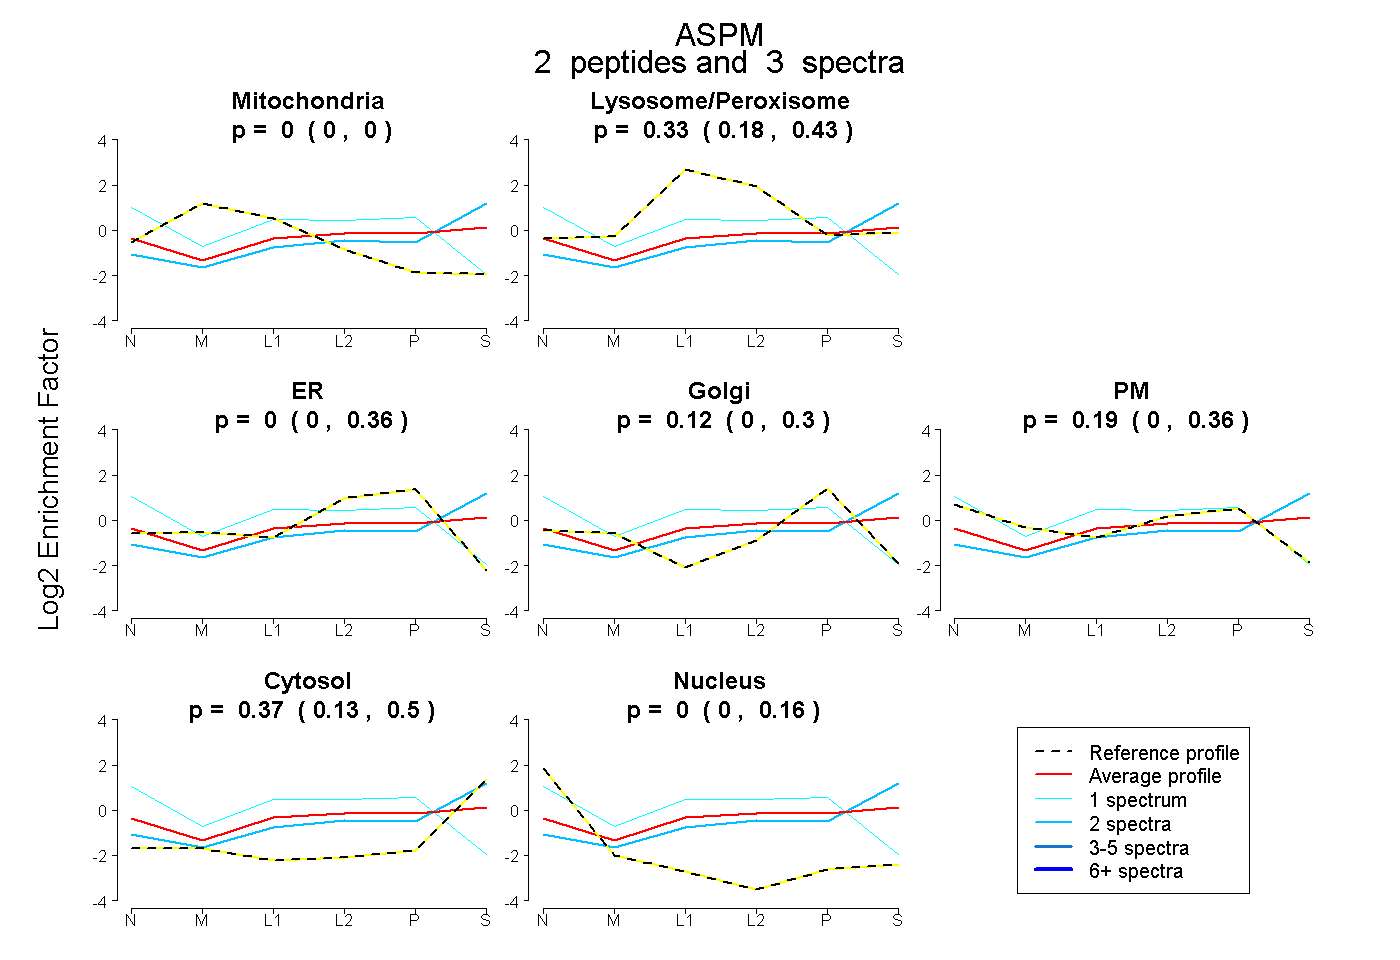 |
0.000 0.000 | 0.000 |
0.326 0.181 | 0.433 |
0.000 0.000 | 0.357 |
0.120 0.000 | 0.297 |
0.187 0.000 | 0.364 |
0.367 0.134 | 0.503 |
0.000 0.000 | 0.157 |
|||
| Plot | Lyso | Other | |||||||||||
| Expt C |
2 peptides |
3 spectra |
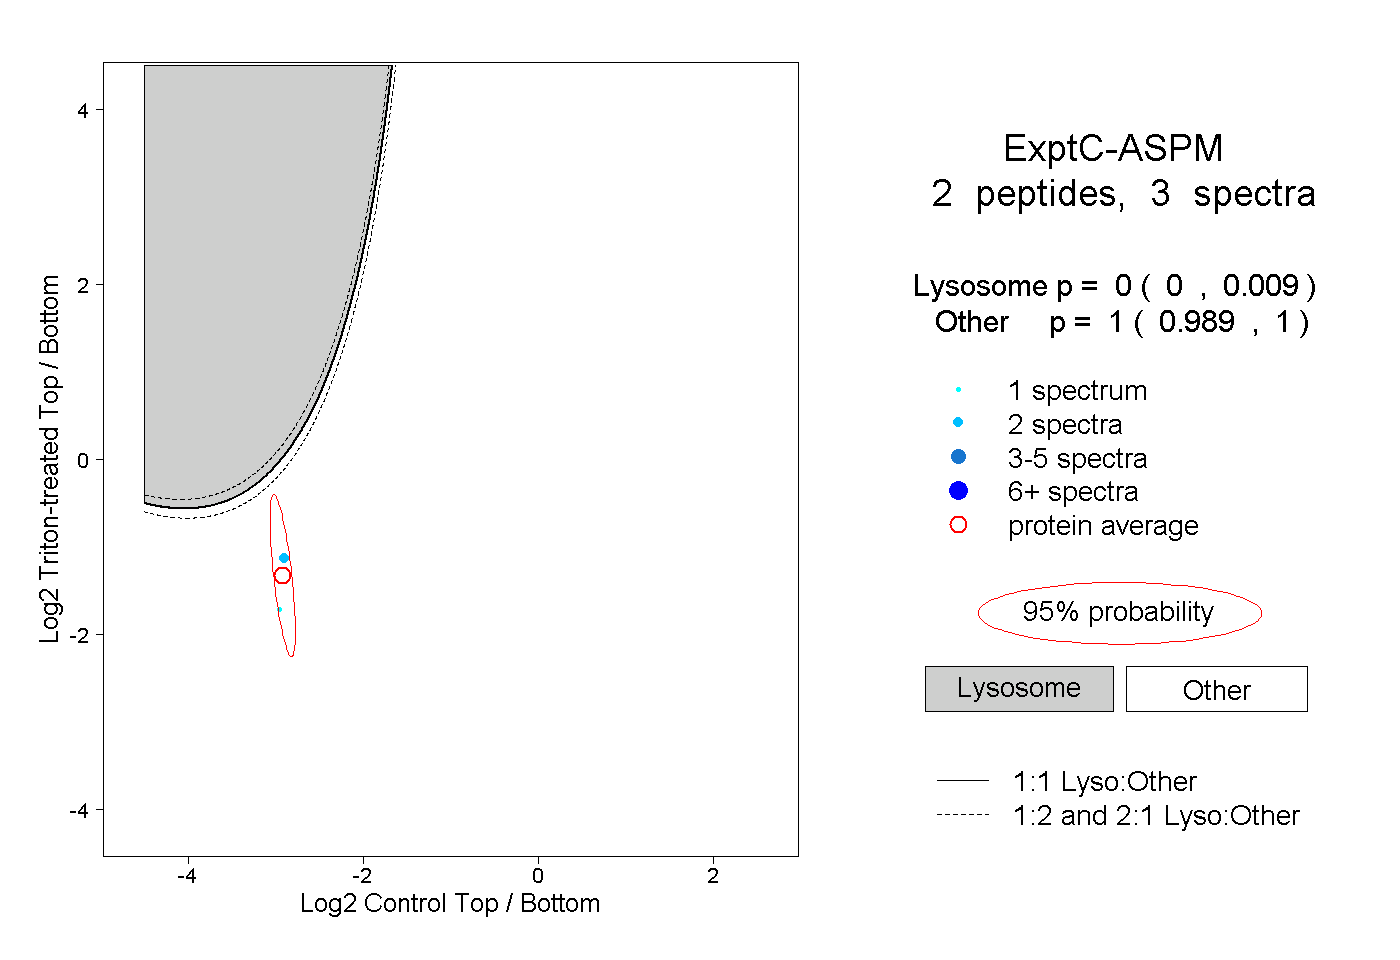 |
0.000 0.000 | 0.009 |
1.000 0.989 | 1.000 |
||||||||
| Plot | Lyso | Other | |||||||||||
| Expt D |
3 peptides |
9 spectra |
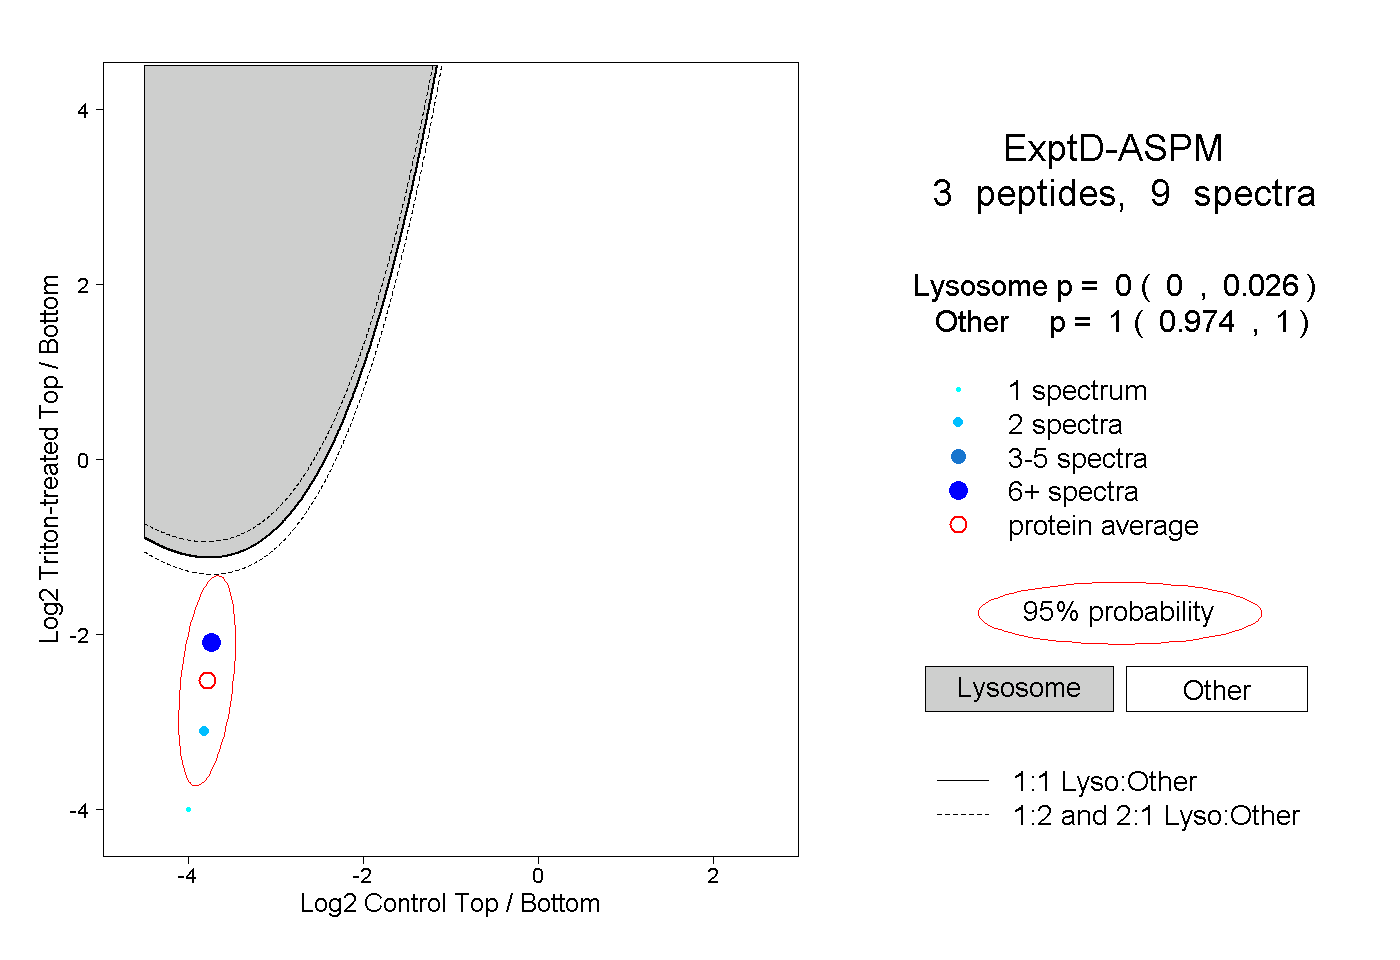 |
0.000 0.000 | 0.026 |
1.000 0.974 | 1.000 |