 8
8peptides
spectra
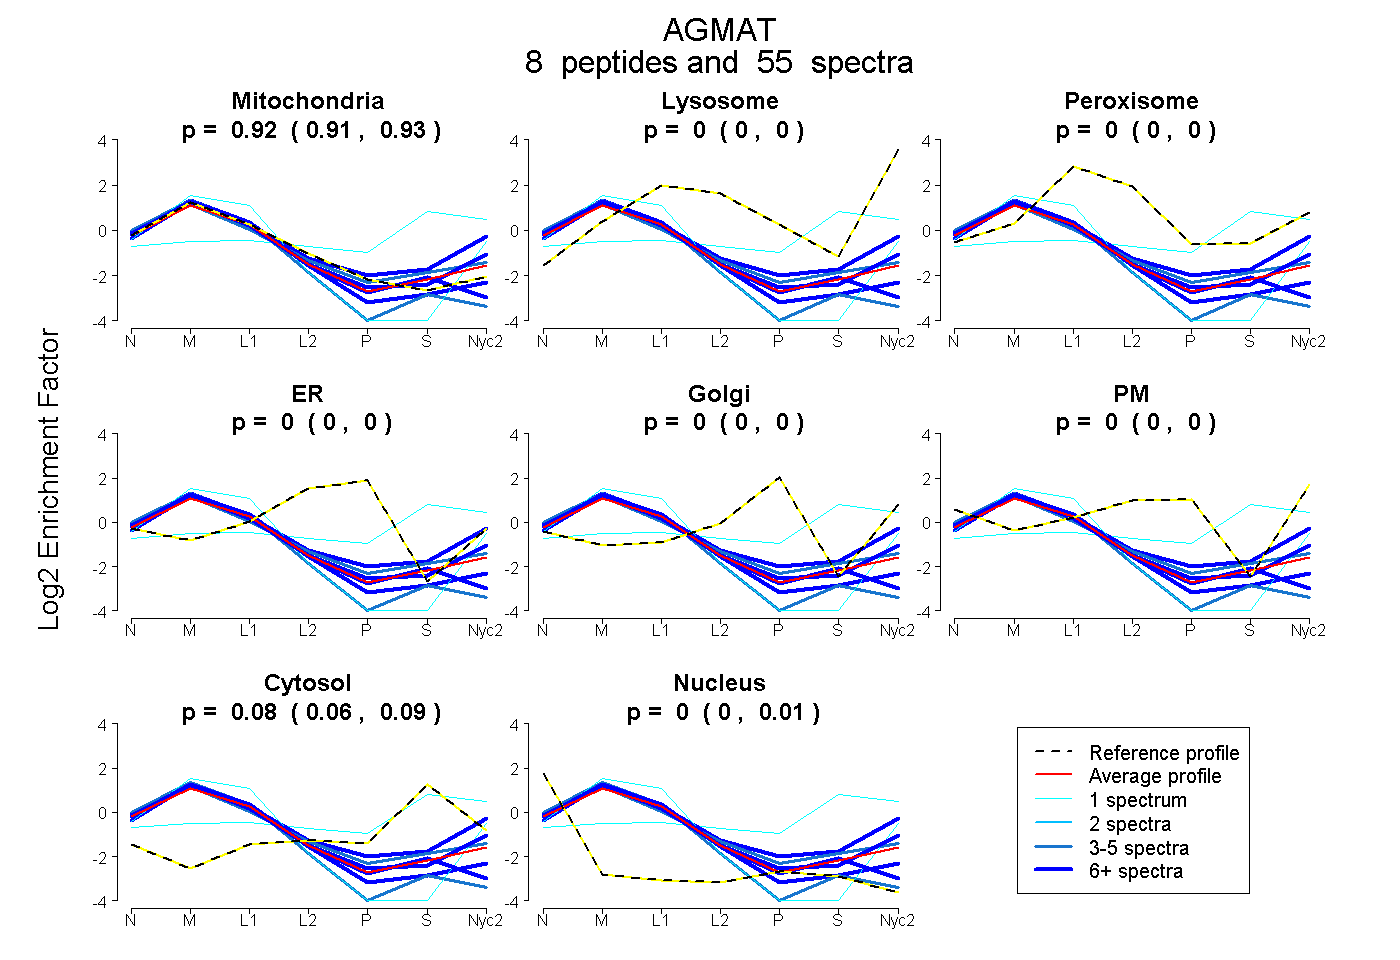
0.910 | 0.934
0.000 | 0.005
0.000 | 0.000
0.000 | 0.000
0.000 | 0.000
0.000 | 0.000
0.061 | 0.087
0.000 | 0.005
5peptides
spectra
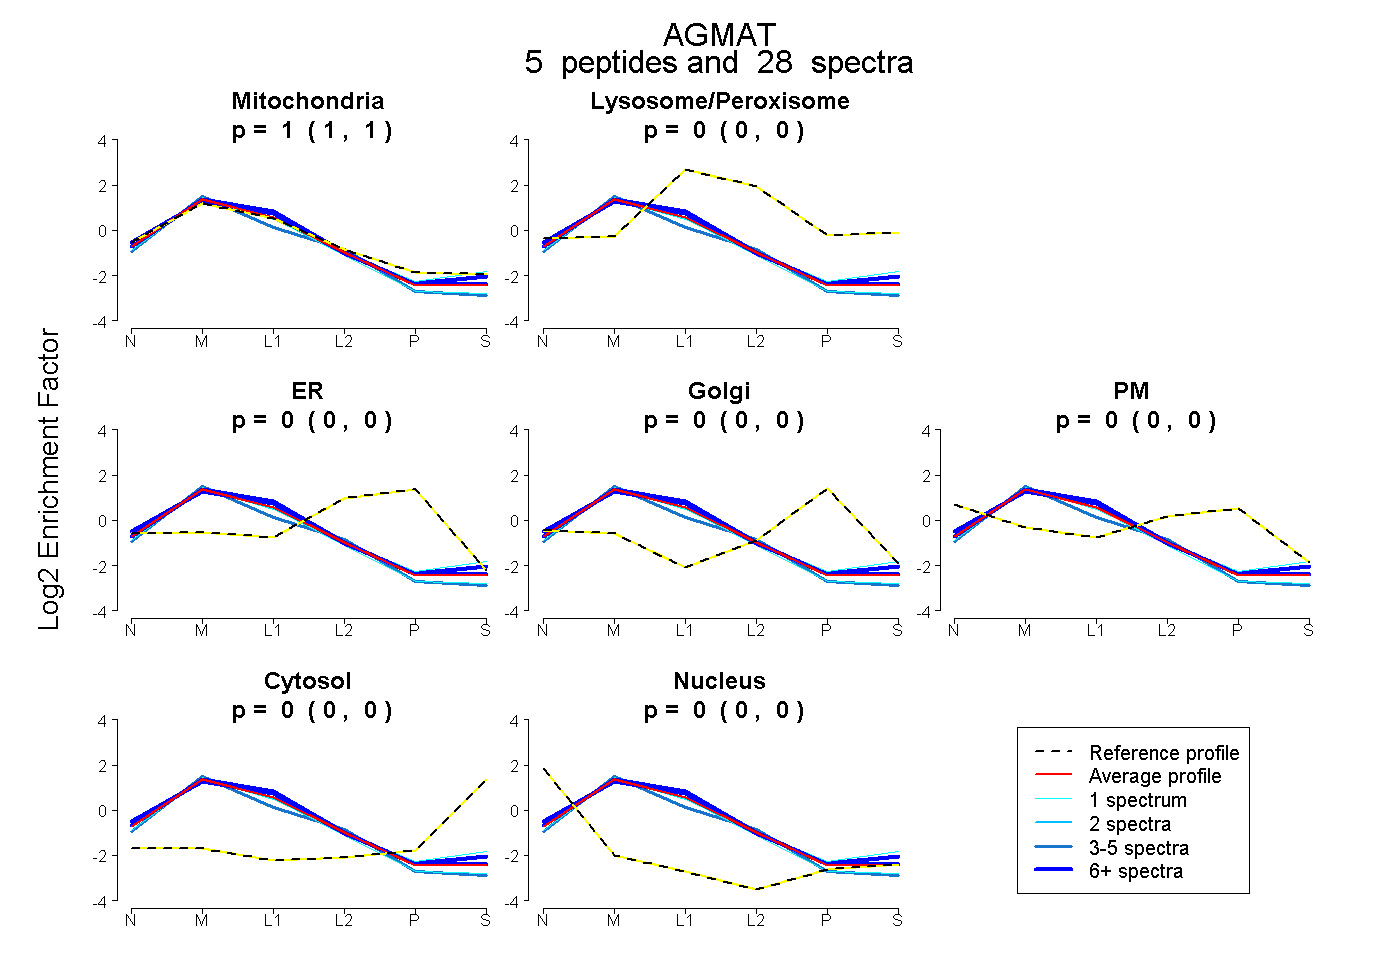
0.998 | 1.000
0.000 | 0.000
0.000 | 0.000
0.000 | 0.000
0.000 | 0.000
0.000 | 0.000
0.000 | 0.001
7peptides
spectra
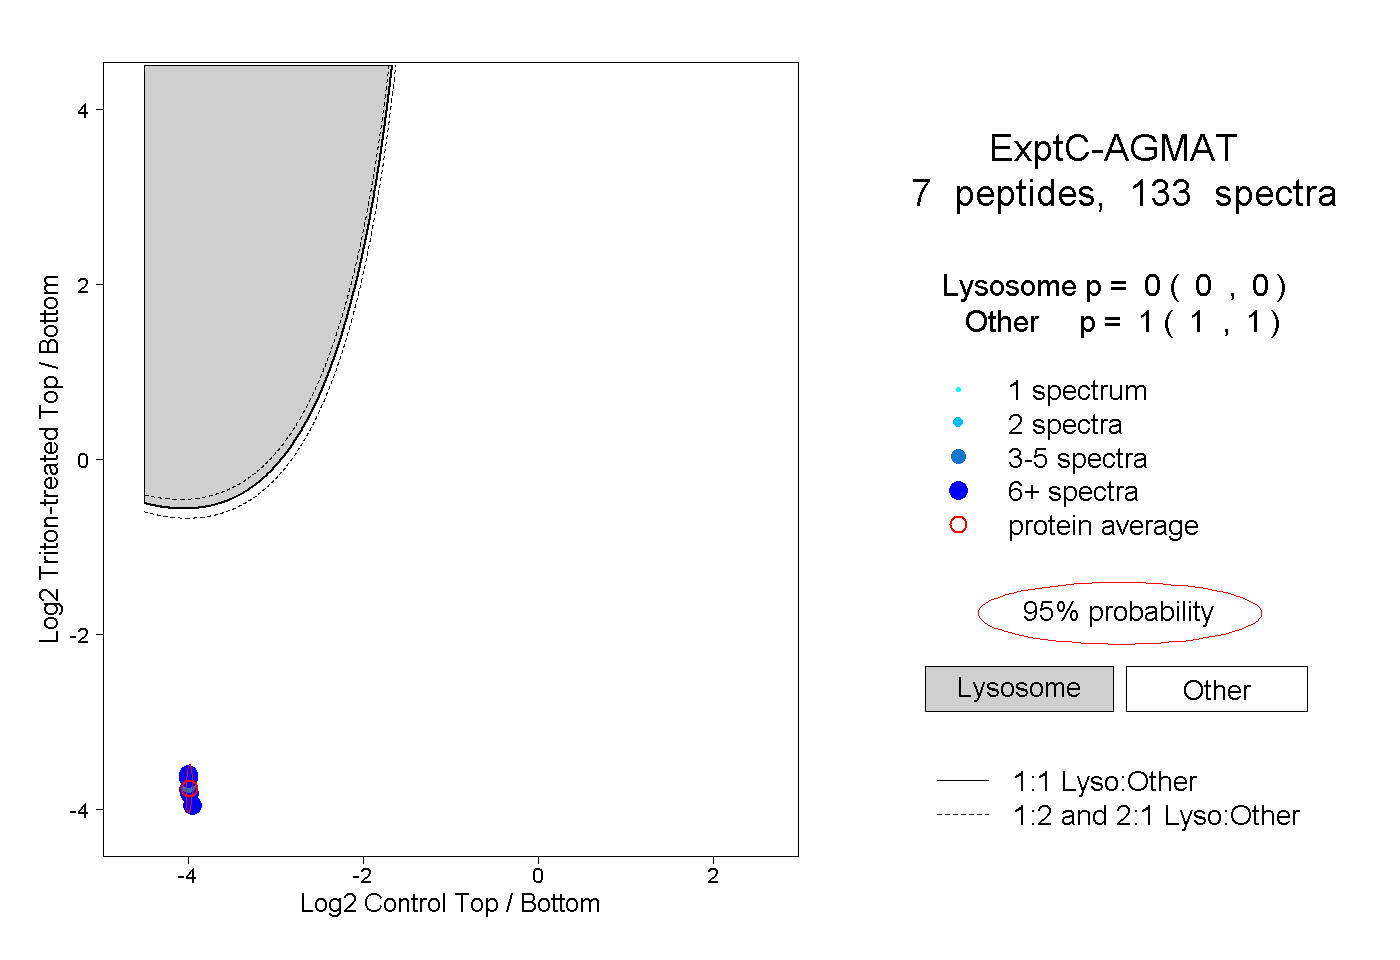
0.000 | 0.000
1.000 | 1.000
3peptides
spectra
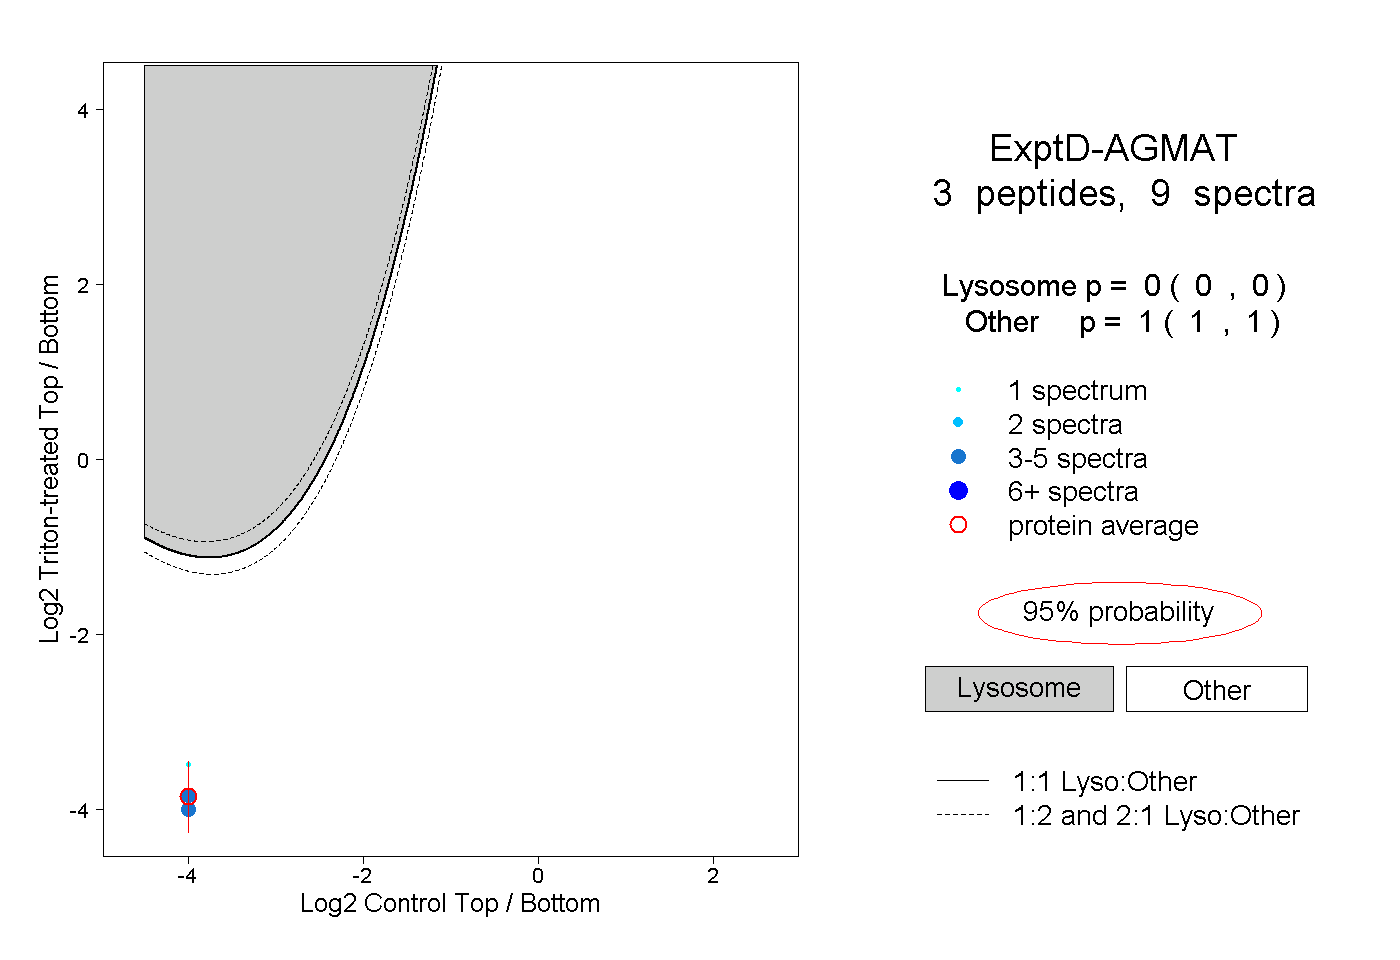
0.000 | 0.000
1.000 | 1.000