 8
8peptides
spectra
0.910 | 0.934
0.000 | 0.005
0.000 | 0.000
0.000 | 0.000
0.000 | 0.000
0.000 | 0.000
0.061 | 0.087
0.000 | 0.005
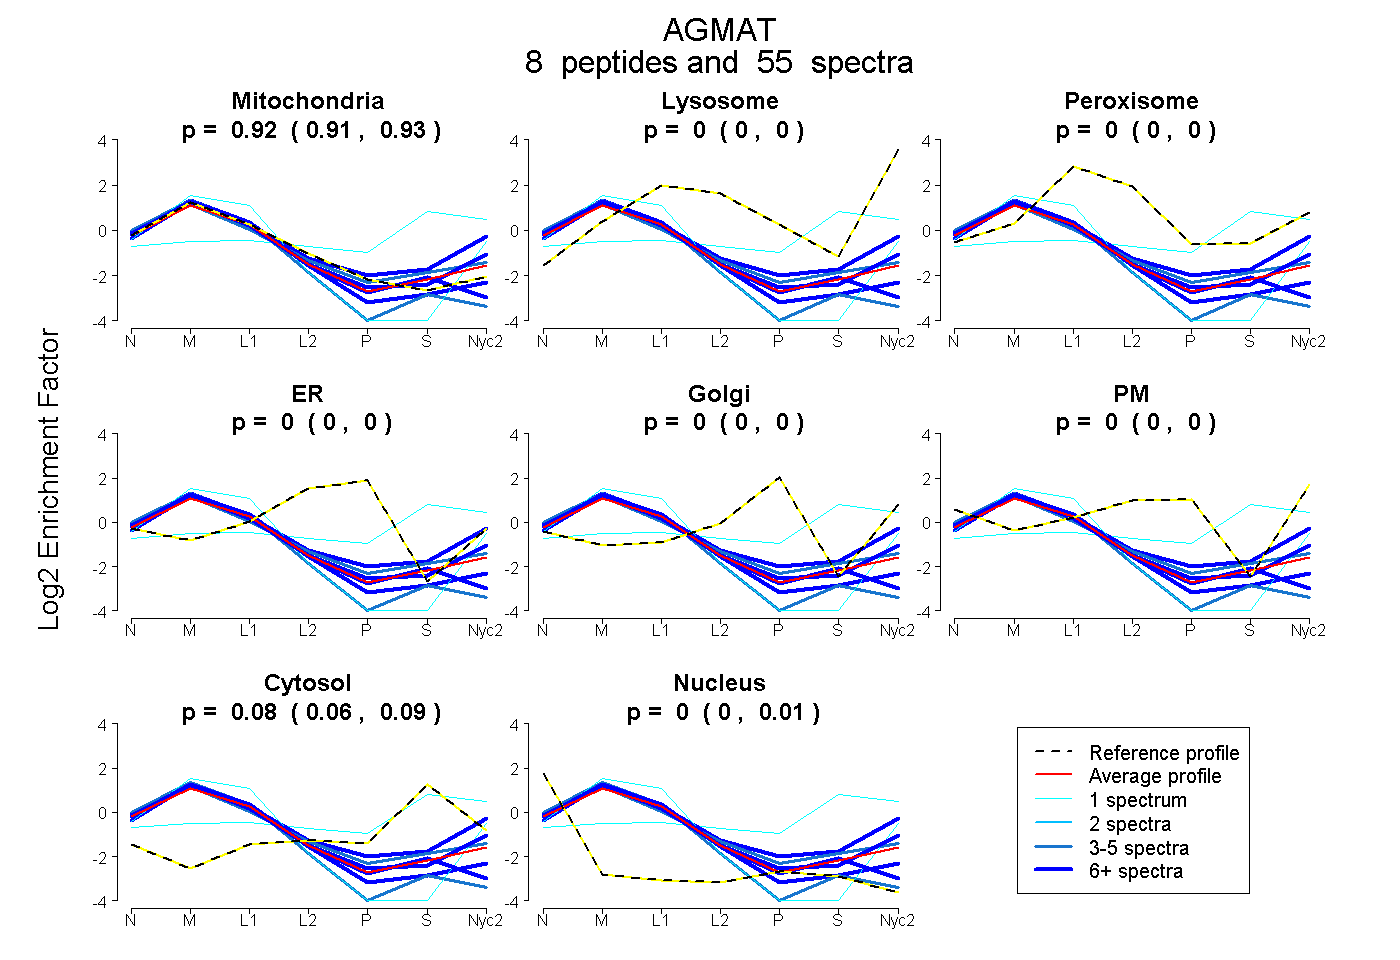
| Plot | Mito | Lyso | Perox | ER | Golgi | PM | Cytosol | Nucleus | |||||
| Expt A |
8 peptides |
55 spectra |
|
0.924 0.910 | 0.934 |
0.000 0.000 | 0.005 |
0.000 0.000 | 0.000 |
0.000 0.000 | 0.000 |
0.000 0.000 | 0.000 |
0.000 0.000 | 0.000 |
0.076 0.061 | 0.087 |
0.000 0.000 | 0.005 |
| 21 spectra, VVQIGIR | 0.861 | 0.088 | 0.000 | 0.000 | 0.000 | 0.000 | 0.000 | 0.051 | ||
| 10 spectra, VVLAEDCWMK | 0.936 | 0.000 | 0.000 | 0.000 | 0.000 | 0.000 | 0.000 | 0.064 | ||
| 9 spectra, SLVPLMAEIR | 0.953 | 0.000 | 0.000 | 0.000 | 0.000 | 0.000 | 0.000 | 0.047 | ||
| 4 spectra, TLDPYR | 0.862 | 0.026 | 0.000 | 0.000 | 0.000 | 0.000 | 0.111 | 0.000 | ||
| 3 spectra, VADLGNVNVNLYNLQDSCR | 0.879 | 0.000 | 0.000 | 0.000 | 0.000 | 0.000 | 0.000 | 0.121 | ||
| 1 spectrum, VCSMMHLPLQSSPEGLDAAFVGVPLDTGTSNRPGAR | 0.978 | 0.022 | 0.000 | 0.000 | 0.000 | 0.000 | 0.000 | 0.000 | ||
| 6 spectra, SVDEGLLDSK | 0.727 | 0.187 | 0.000 | 0.000 | 0.000 | 0.000 | 0.086 | 0.000 | ||
| 1 spectrum, LQLLK | 0.125 | 0.277 | 0.002 | 0.000 | 0.000 | 0.000 | 0.595 | 0.000 |
| Plot | Mito | Lyso or Perox | ER | Golgi | PM | Cytosol | Nucleus | ||||||
| Expt B |
5 peptides |
28 spectra |
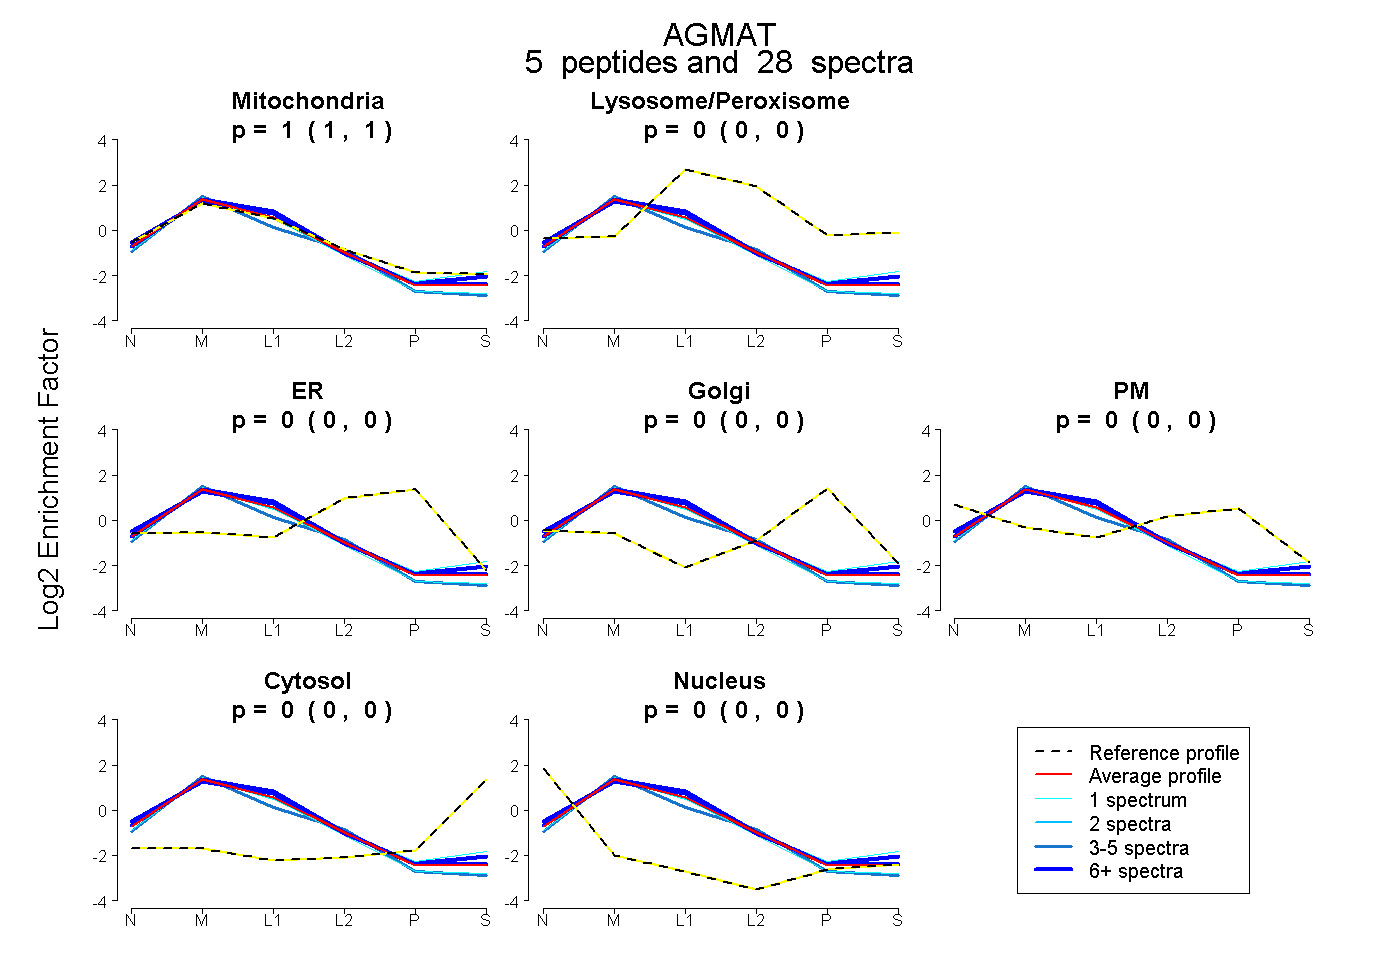 |
1.000 0.998 | 1.000 |
0.000 0.000 | 0.000 |
0.000 0.000 | 0.000 |
0.000 0.000 | 0.000 |
0.000 0.000 | 0.000 |
0.000 0.000 | 0.000 |
0.000 0.000 | 0.001 |
|||
| Plot | Lyso | Other | |||||||||||
| Expt C |
7 peptides |
133 spectra |
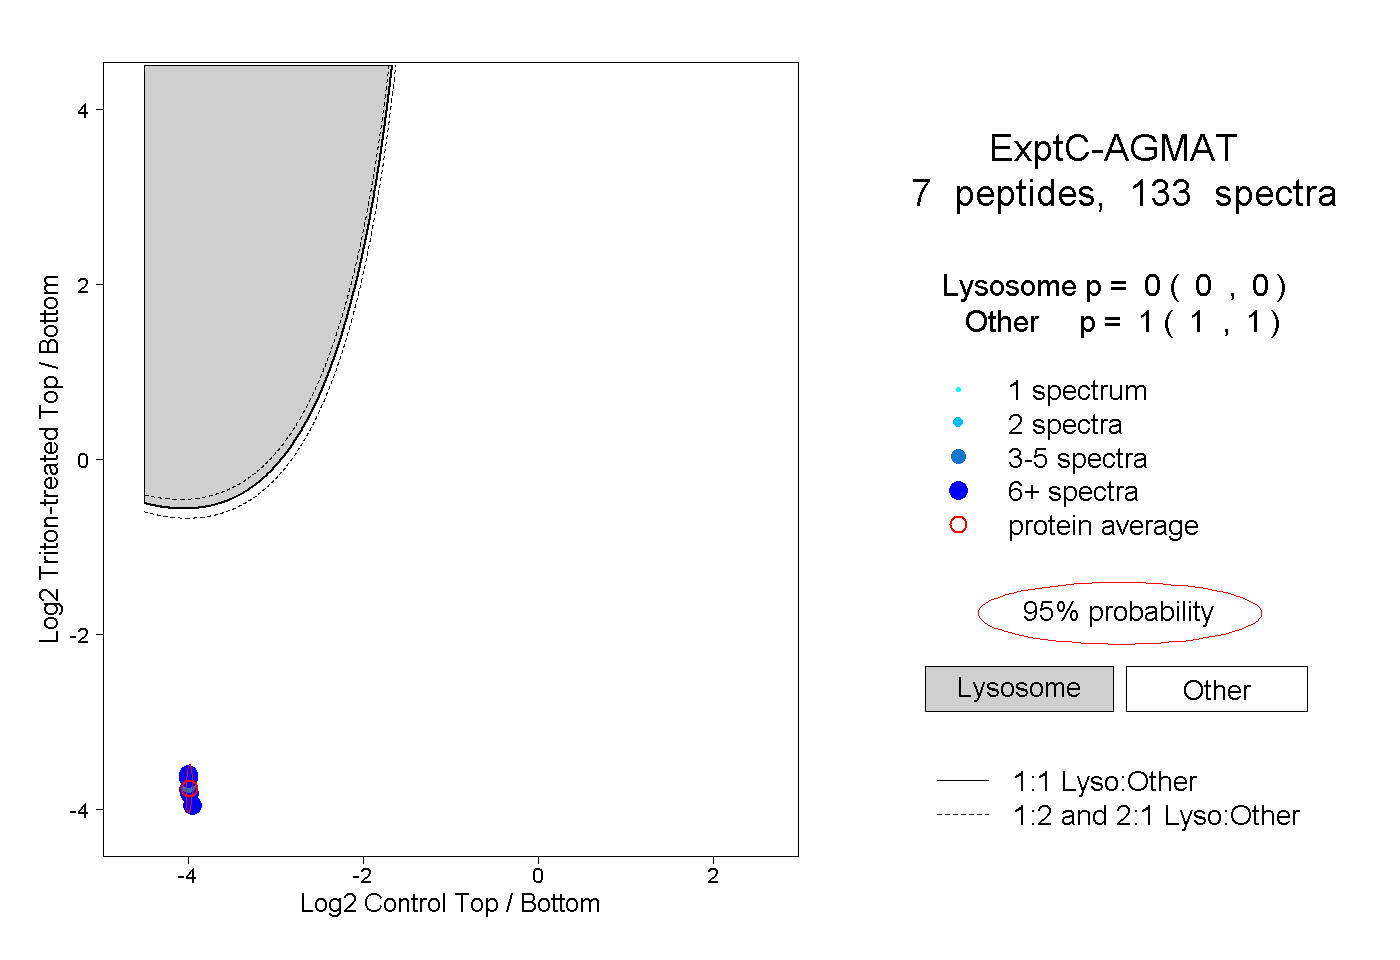 |
0.000 0.000 | 0.000 |
1.000 1.000 | 1.000 |
||||||||
| Plot | Lyso | Other | |||||||||||
| Expt D |
3 peptides |
9 spectra |
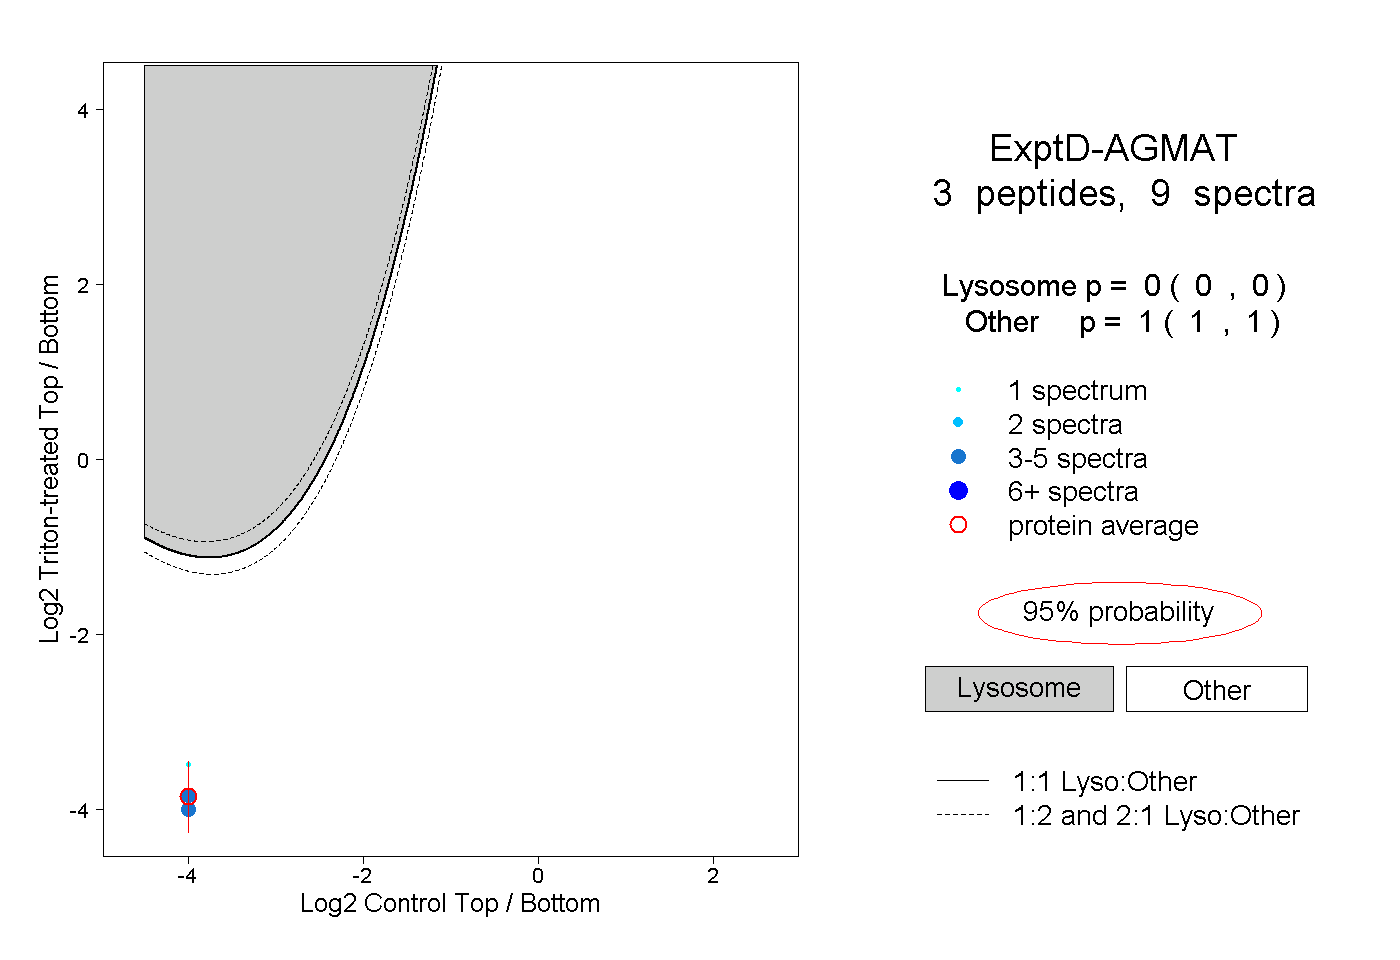 |
0.000 0.000 | 0.000 |
1.000 1.000 | 1.000 |