 3
3peptides
spectra

0.000 | 0.000
0.014 | 0.082
0.000 | 0.114
0.000 | 0.051
0.071 | 0.259
0.527 | 0.726
0.015 | 0.102
0.000 | 0.000
2peptides
spectra
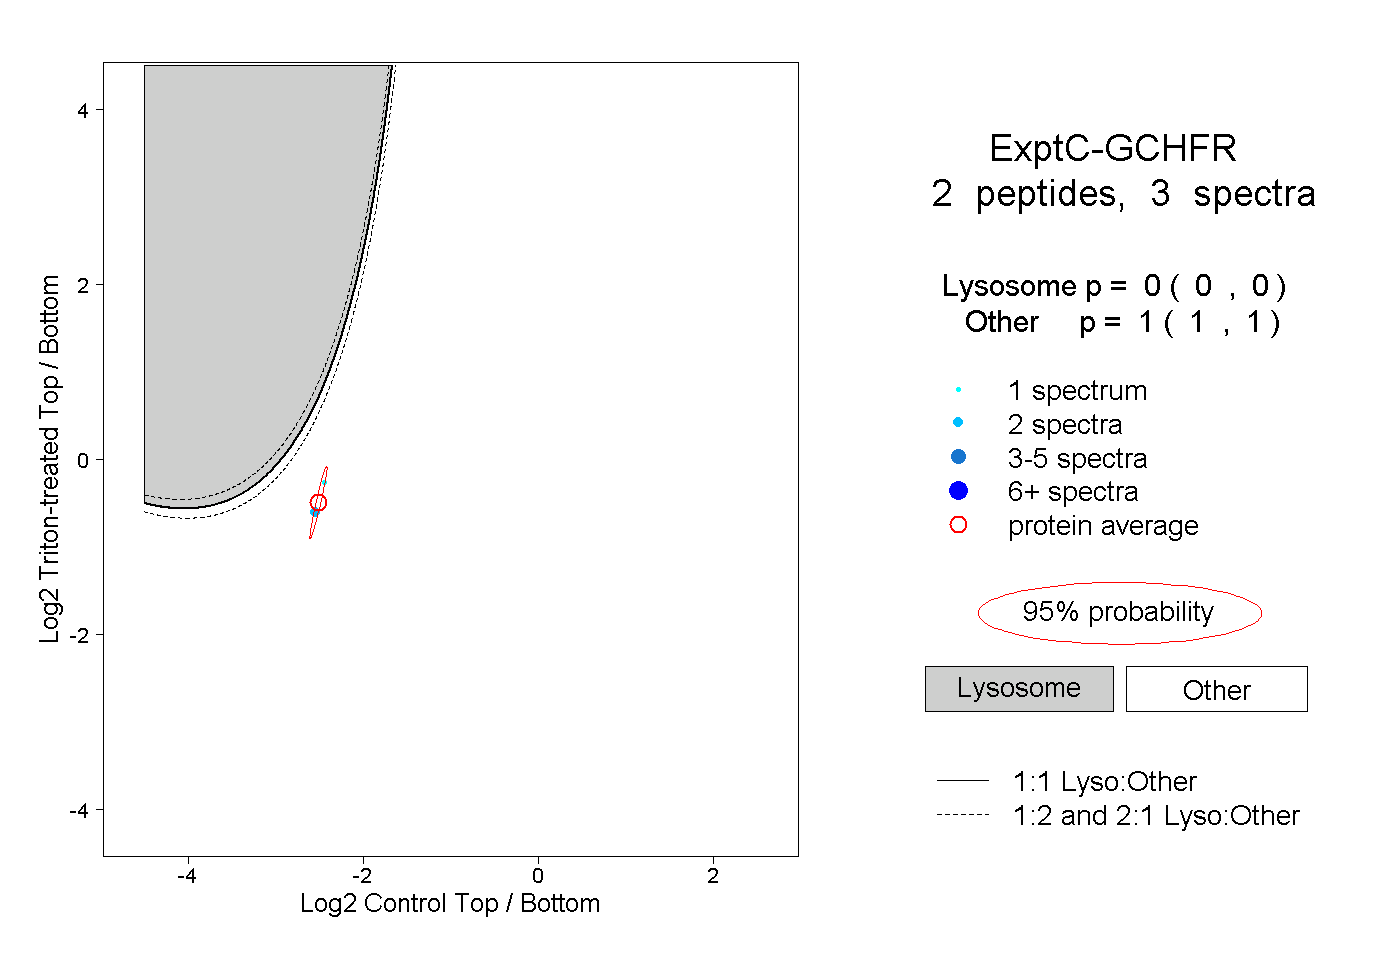
0.000 | 0.000
1.000 | 1.000
1peptide
spectrum
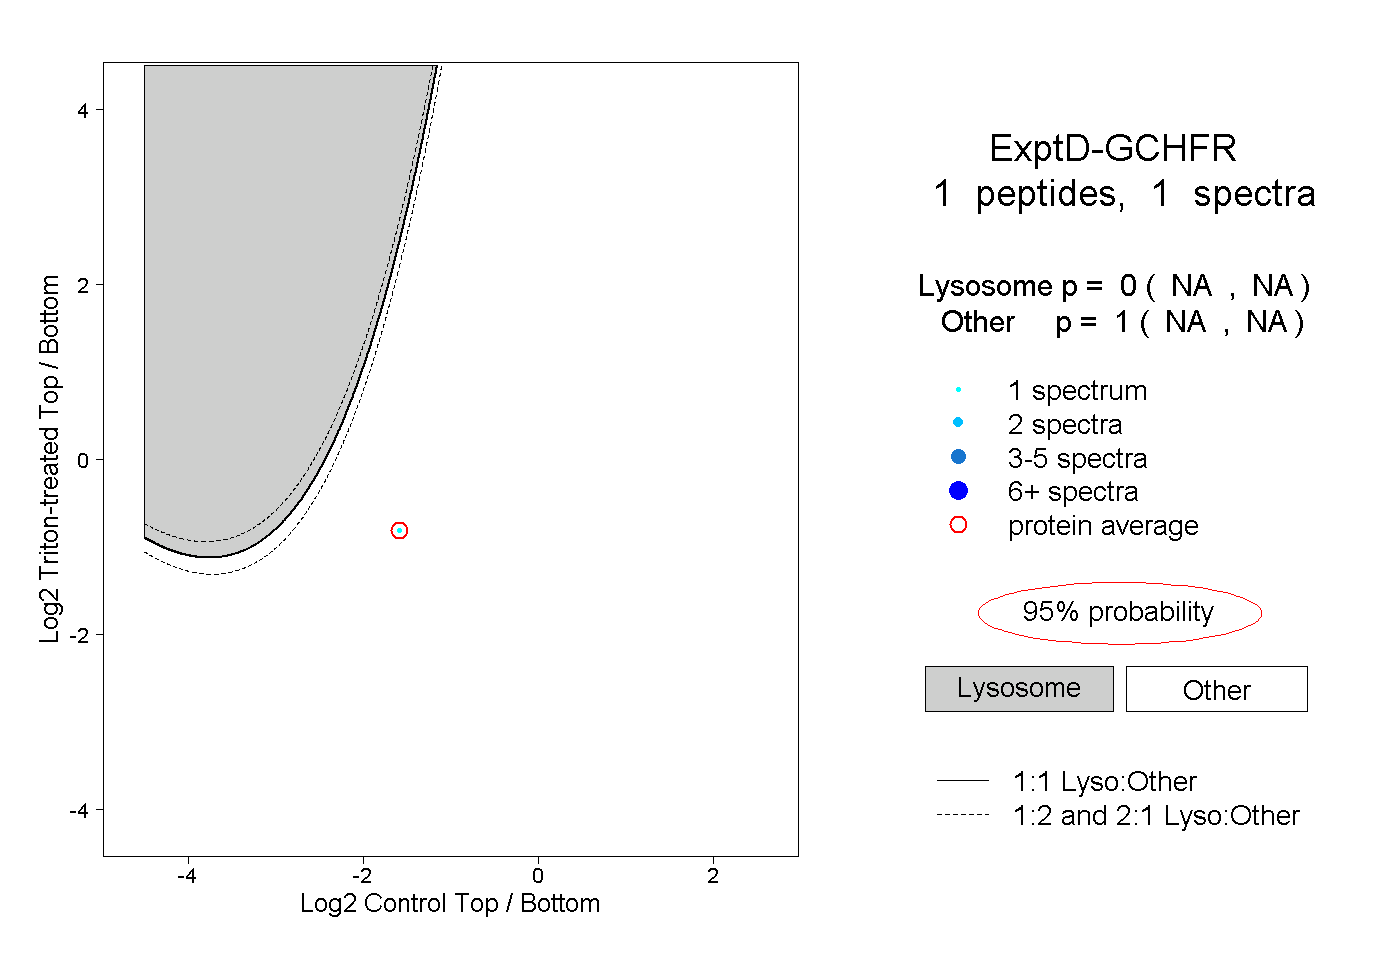
NA | NA
NA | NA