 3
3peptides
spectra

0.000 | 0.000
0.014 | 0.082
0.000 | 0.114
0.000 | 0.051
0.071 | 0.259
0.527 | 0.726
0.015 | 0.102
0.000 | 0.000
| Plot | Mito | Lyso | Perox | ER | Golgi | PM | Cytosol | Nucleus | |||||
| Expt A |
3 peptides |
7 spectra |
|
0.000 0.000 | 0.000 |
0.050 0.014 | 0.082 |
0.076 0.000 | 0.114 |
0.000 0.000 | 0.051 |
0.186 0.071 | 0.259 |
0.632 0.527 | 0.726 |
0.057 0.015 | 0.102 |
0.000 0.000 | 0.000 |
| 2 spectra, VLGNNFYEYYVNDPPR | 0.000 | 0.045 | 0.041 | 0.000 | 0.052 | 0.778 | 0.084 | 0.000 | ||
| 1 spectrum, MEVGPTMVGDEHSDPELMQQLGASK | 0.000 | 0.181 | 0.040 | 0.202 | 0.257 | 0.182 | 0.138 | 0.000 | ||
| 4 spectra, PYLLISTQIR | 0.000 | 0.042 | 0.027 | 0.000 | 0.000 | 0.879 | 0.051 | 0.000 |
| Plot | Lyso | Other | |||||||||||
| Expt C |
2 peptides |
3 spectra |
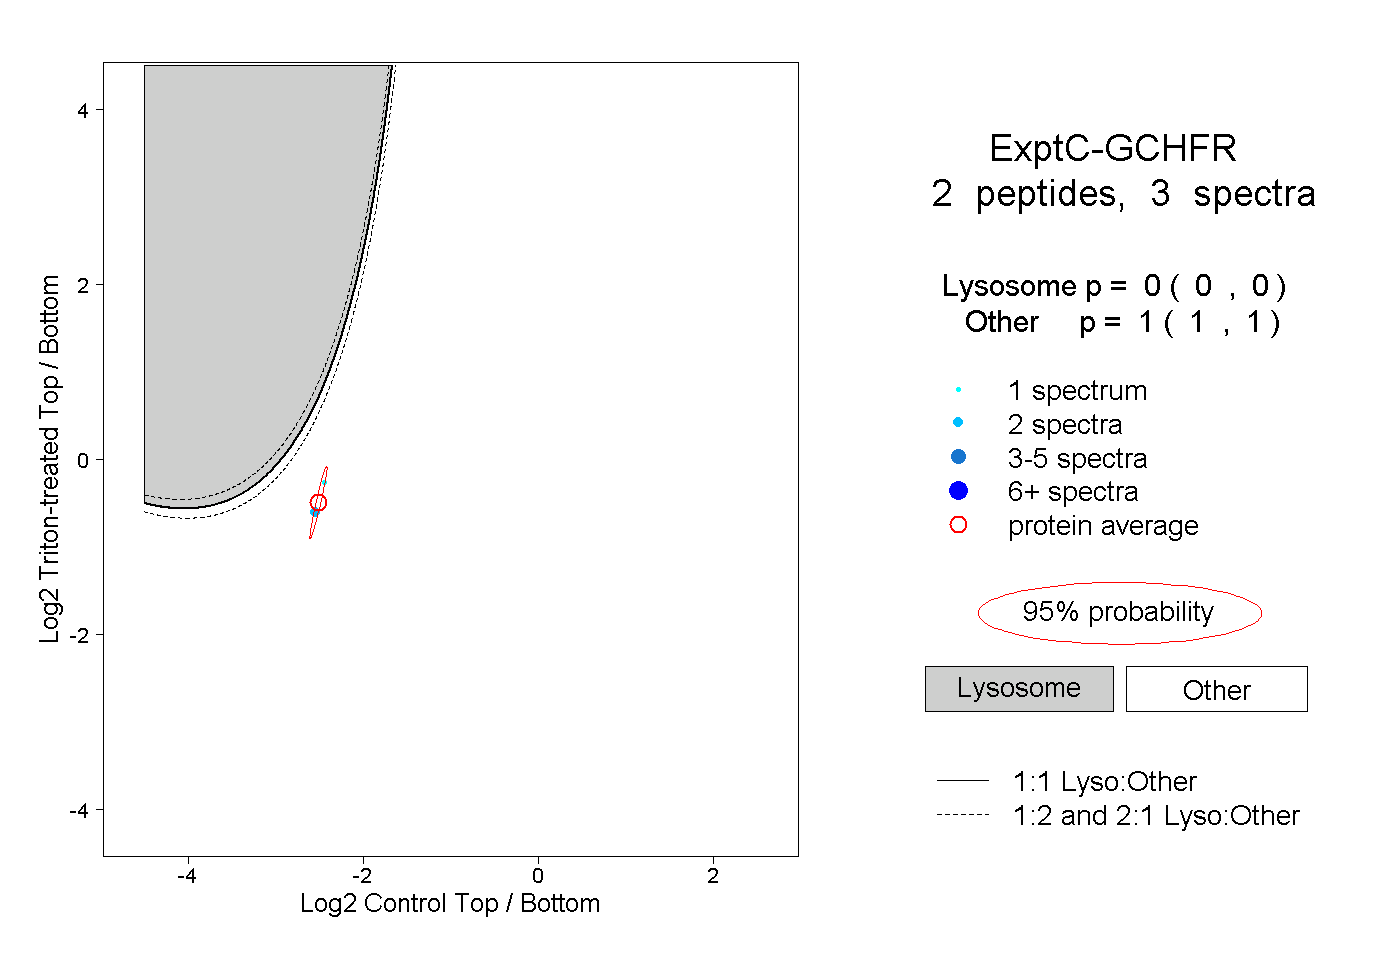 |
0.000 0.000 | 0.000 |
1.000 1.000 | 1.000 |
||||||||
| Plot | Lyso | Other | |||||||||||
| Expt D |
1 peptide |
1 spectrum |
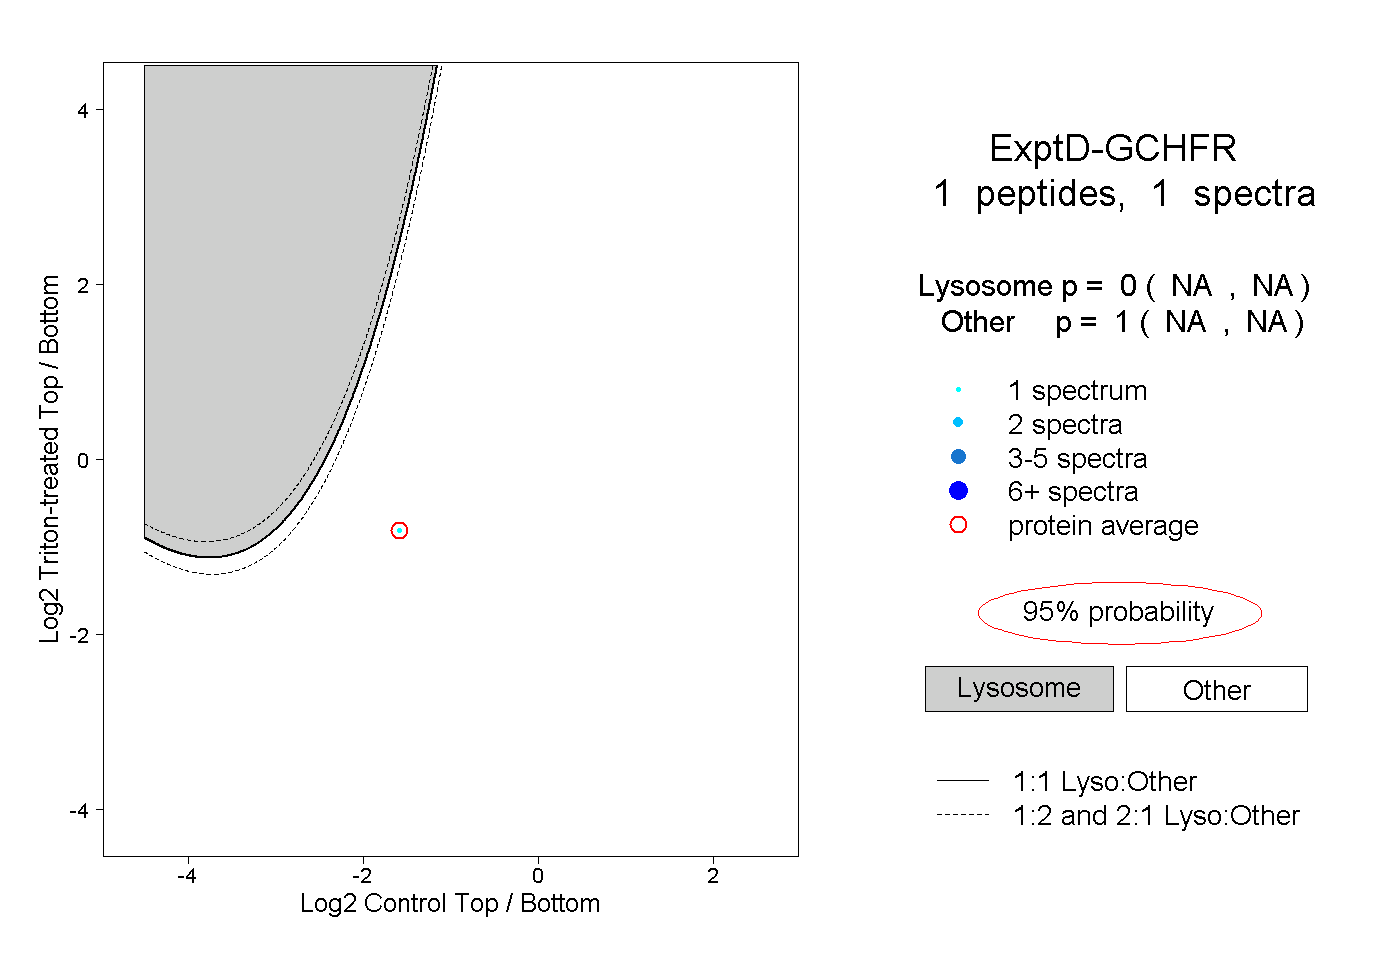 |
0.000 NA | NA |
1.000 NA | NA |