 6
6peptides
spectra
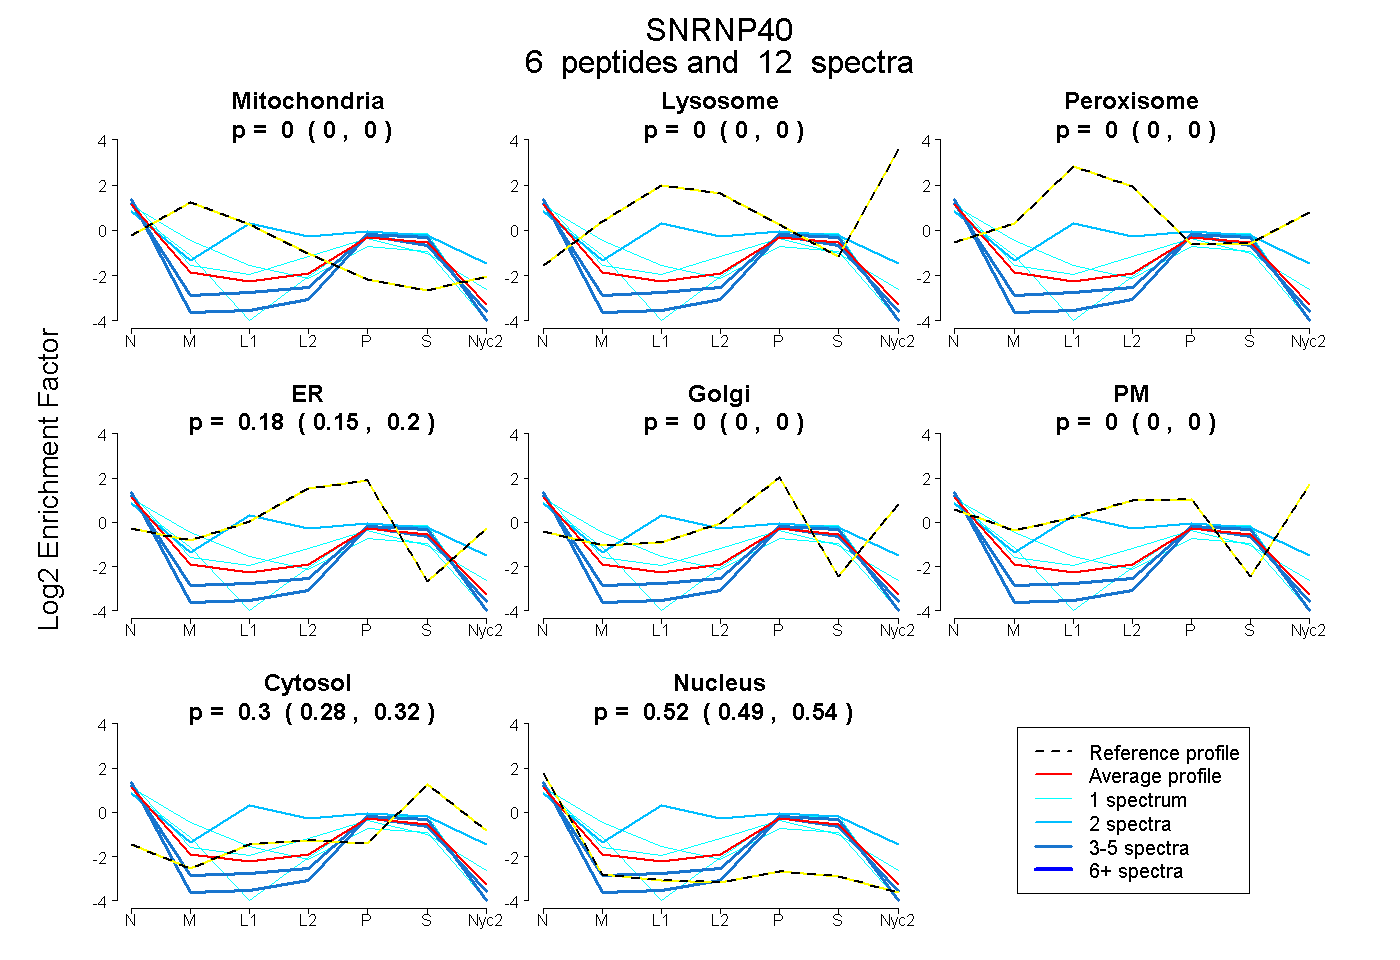
0.000 | 0.000
0.000 | 0.000
0.000 | 0.000
0.145 | 0.204
0.000 | 0.000
0.000 | 0.000
0.281 | 0.321
0.489 | 0.542
2peptides
spectra
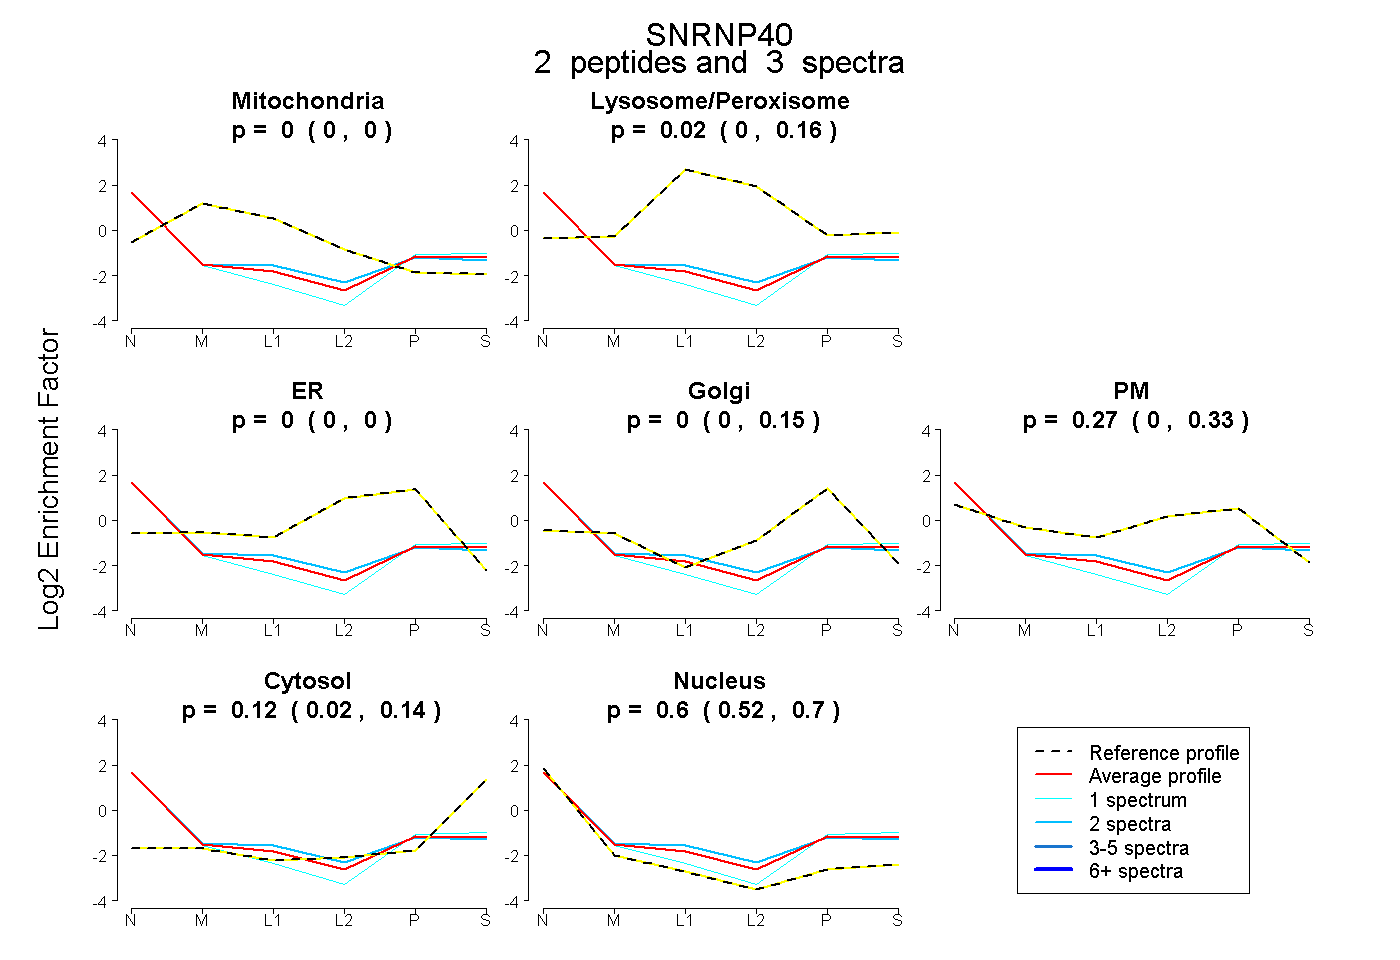
0.000 | 0.000
0.000 | 0.162
0.000 | 0.000
0.000 | 0.151
0.000 | 0.334
0.022 | 0.144
0.521 | 0.703