SNRNP40
[ENSRNOP00000016325]
Main page
| | | Plot |
Mito |
Lyso |
|
Perox |
ER |
Golgi |
PM |
Cytosol |
Nucleus |
|
| Expt A |
 6
6
peptides |
12
spectra |
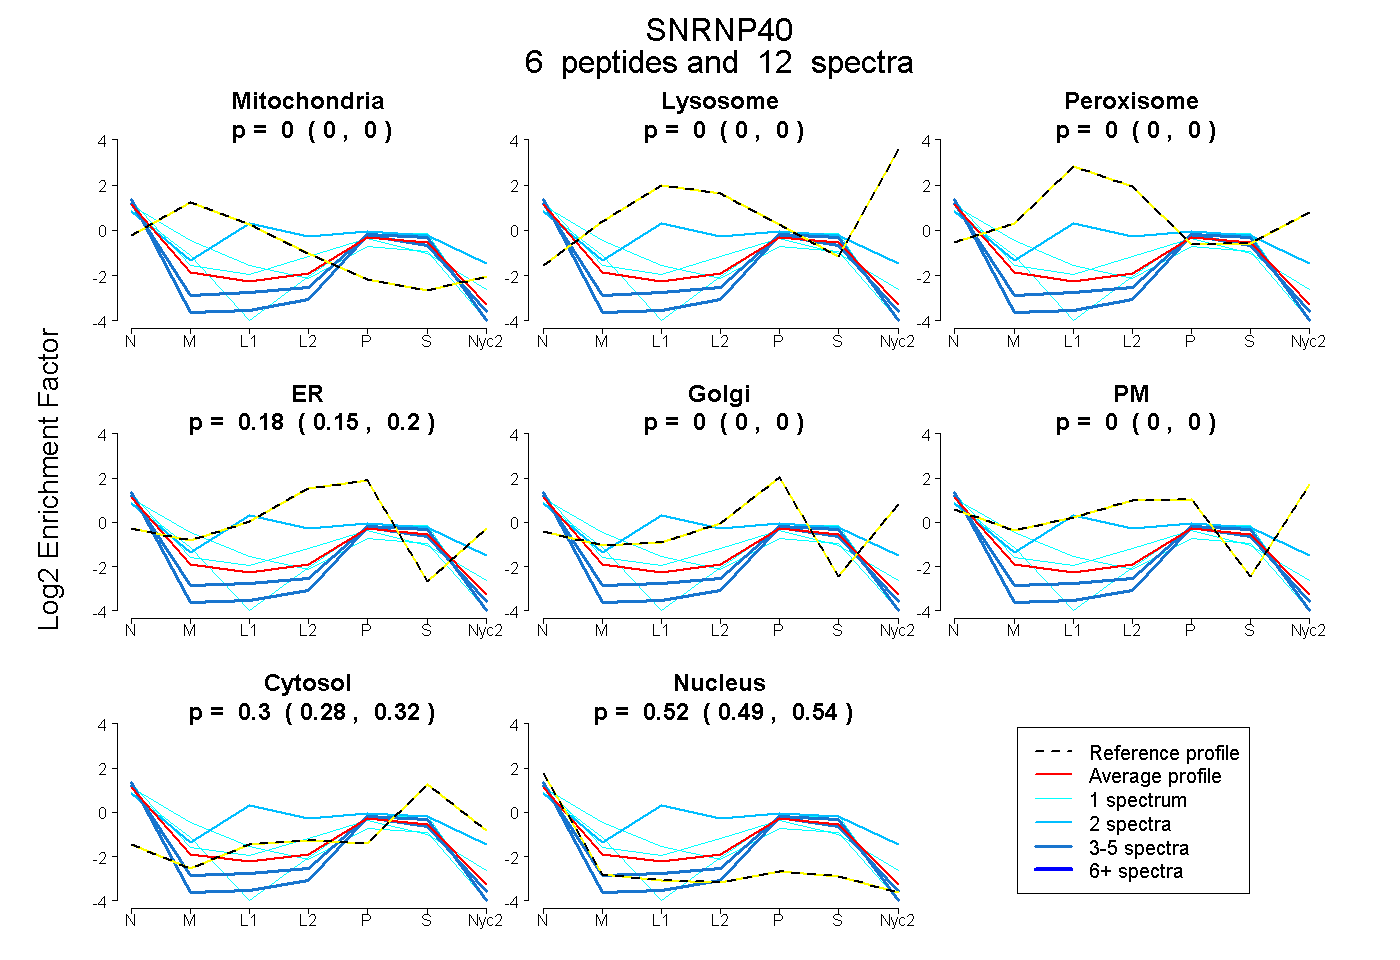 |
0.000
0.000 | 0.000 |
0.000
0.000 | 0.000 |
|
0.000
0.000 | 0.000 |
0.178
0.145 | 0.204 |
0.000
0.000 | 0.000 |
0.000
0.000 | 0.000 |
0.304
0.281 | 0.321 |
0.518
0.489 | 0.542 |
|
| | | Plot |
Mito |
|
Lyso or Perox |
|
ER |
Golgi |
PM |
Cytosol |
Nucleus |
|
| Expt B |
2
peptides |
3
spectra |
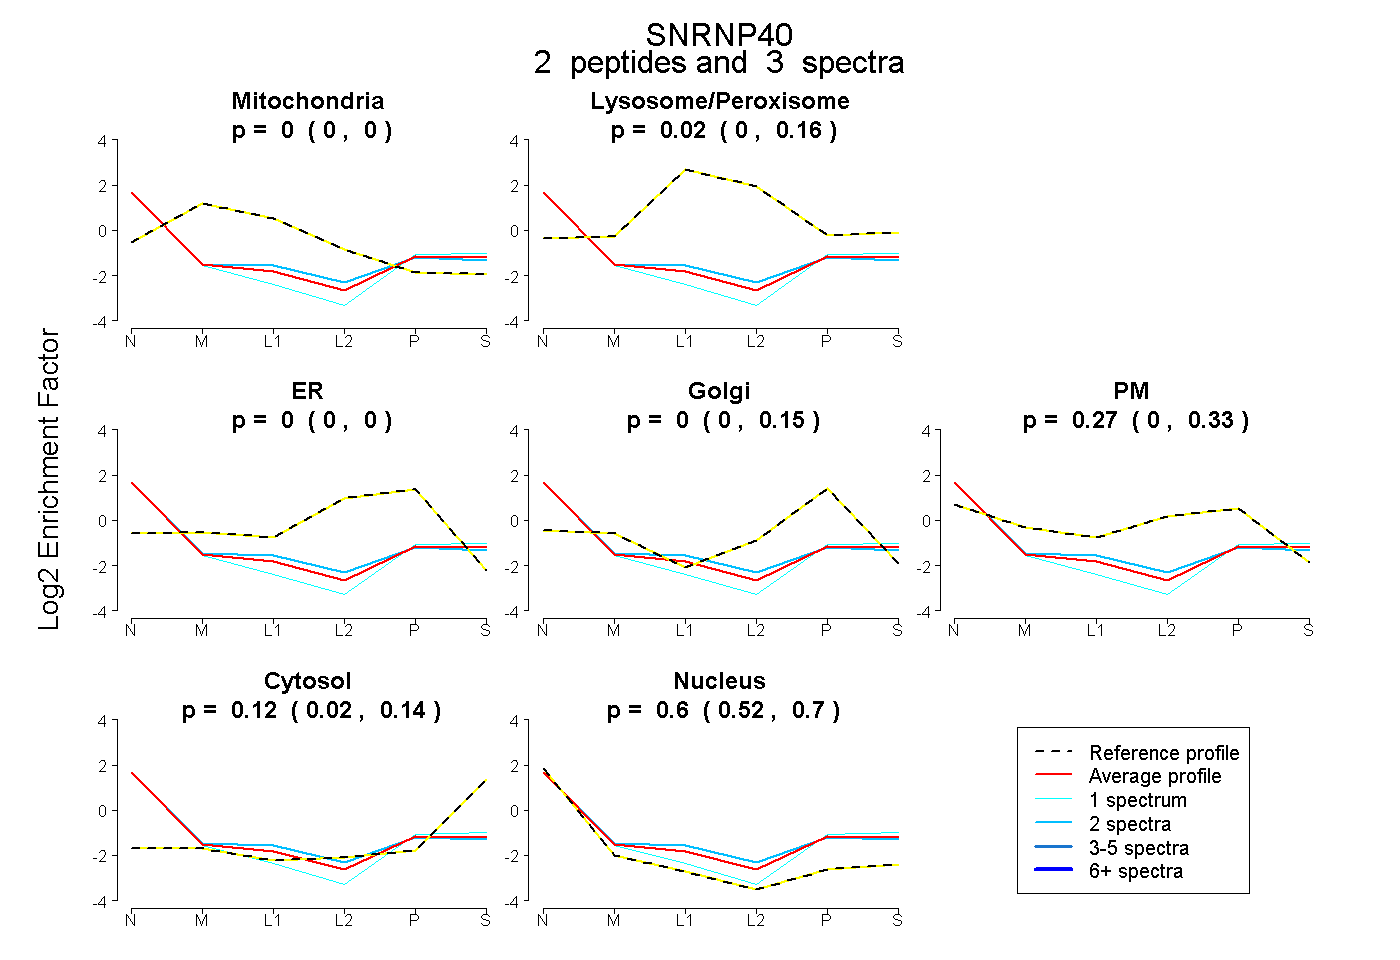 |
0.000
0.000 | 0.000 |
|
0.020
0.000 | 0.162 |
|
0.000
0.000 | 0.000 |
0.000
0.000 | 0.151 |
0.267
0.000 | 0.334 |
0.115
0.022 | 0.144 |
0.598
0.521 | 0.703 |
|
| 1 spectrum, FVYVWDTTSR |
0.000 |
|
0.000 |
|
0.000 |
0.199 |
0.000 |
0.144 |
0.657 |
|
| 2 spectra, IAAGSADR |
0.000 |
|
0.098 |
|
0.000 |
0.000 |
0.232 |
0.061 |
0.609 |
|