 11
11peptides
spectra

0.000 | 0.000
0.000 | 0.000
0.000 | 0.000
0.000 | 0.000
0.009 | 0.053
0.129 | 0.172
0.805 | 0.819
0.000 | 0.005
8peptides
spectra
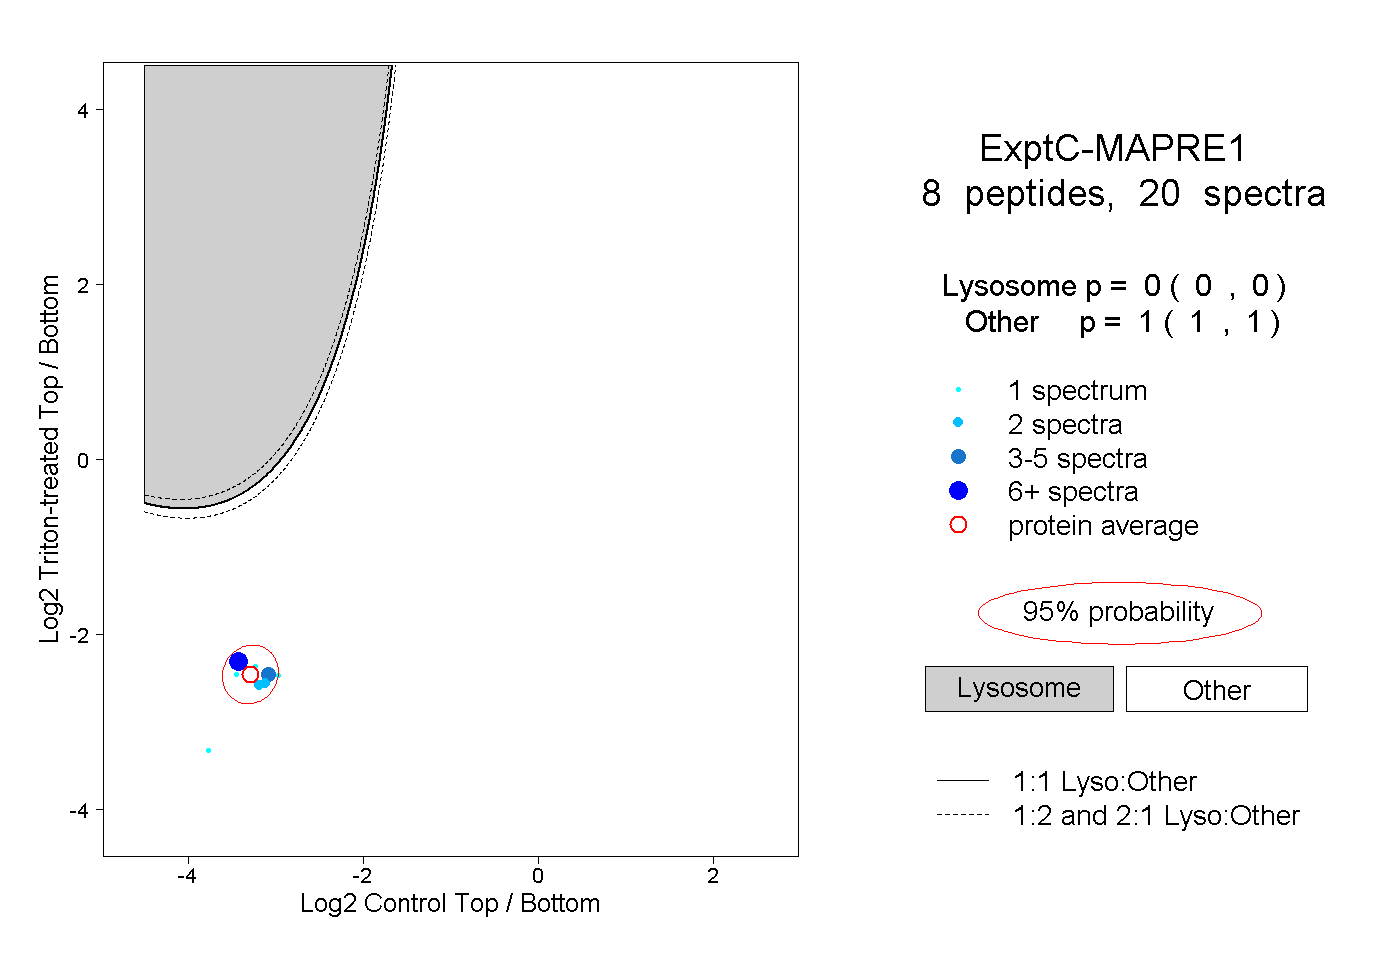
0.000 | 0.000
1.000 | 1.000
1peptide
spectrum
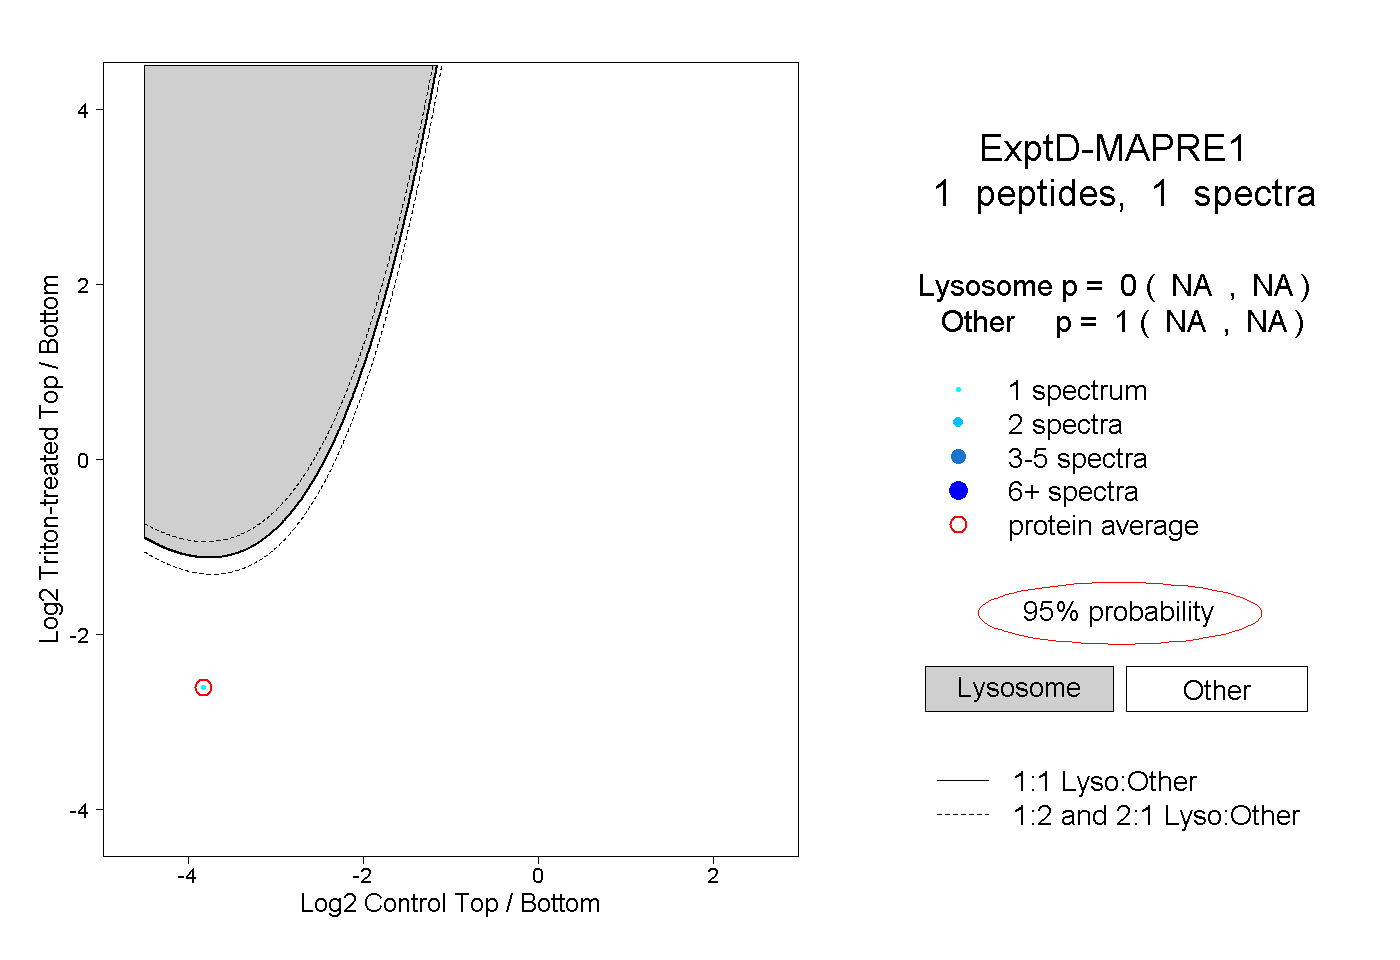
NA | NA
NA | NA