 11
11peptides
spectra

0.000 | 0.000
0.000 | 0.000
0.000 | 0.000
0.000 | 0.000
0.009 | 0.053
0.129 | 0.172
0.805 | 0.819
0.000 | 0.005
| Plot | Mito | Lyso | Perox | ER | Golgi | PM | Cytosol | Nucleus | |||||
| Expt A |
11 peptides |
19 spectra |
|
0.000 0.000 | 0.000 |
0.000 0.000 | 0.000 |
0.000 0.000 | 0.000 |
0.000 0.000 | 0.000 |
0.035 0.009 | 0.053 |
0.152 0.129 | 0.172 |
0.814 0.805 | 0.819 |
0.000 0.000 | 0.005 |
| 2 spectra, DFYFGK | 0.000 | 0.000 | 0.000 | 0.000 | 0.085 | 0.005 | 0.842 | 0.068 | ||
| 2 spectra, ILQAGFK | 0.000 | 0.000 | 0.000 | 0.000 | 0.000 | 0.276 | 0.724 | 0.000 | ||
| 4 spectra, LTVEDLEK | 0.000 | 0.000 | 0.000 | 0.000 | 0.000 | 0.152 | 0.846 | 0.001 | ||
| 2 spectra, LEHEYIQNFK | 0.000 | 0.000 | 0.000 | 0.055 | 0.000 | 0.000 | 0.906 | 0.038 | ||
| 1 spectrum, NIELICQENEGENDPVLQR | 0.042 | 0.017 | 0.127 | 0.000 | 0.000 | 0.189 | 0.625 | 0.000 | ||
| 1 spectrum, AGPGMVR | 0.000 | 0.000 | 0.000 | 0.000 | 0.146 | 0.080 | 0.774 | 0.000 | ||
| 1 spectrum, FFDANYDGK | 0.000 | 0.000 | 0.000 | 0.059 | 0.166 | 0.000 | 0.775 | 0.000 | ||
| 1 spectrum, IIPVDK | 0.000 | 0.000 | 0.000 | 0.000 | 0.000 | 0.203 | 0.750 | 0.047 | ||
| 2 spectra, TTAAPK | 0.000 | 0.000 | 0.000 | 0.059 | 0.010 | 0.121 | 0.810 | 0.000 | ||
| 2 spectra, EYDPVAAR | 0.000 | 0.000 | 0.000 | 0.000 | 0.039 | 0.129 | 0.813 | 0.018 | ||
| 1 spectrum, FQDNFEFVQWFK | 0.000 | 0.000 | 0.000 | 0.000 | 0.177 | 0.076 | 0.747 | 0.000 |
| Plot | Lyso | Other | |||||||||||
| Expt C |
8 peptides |
20 spectra |
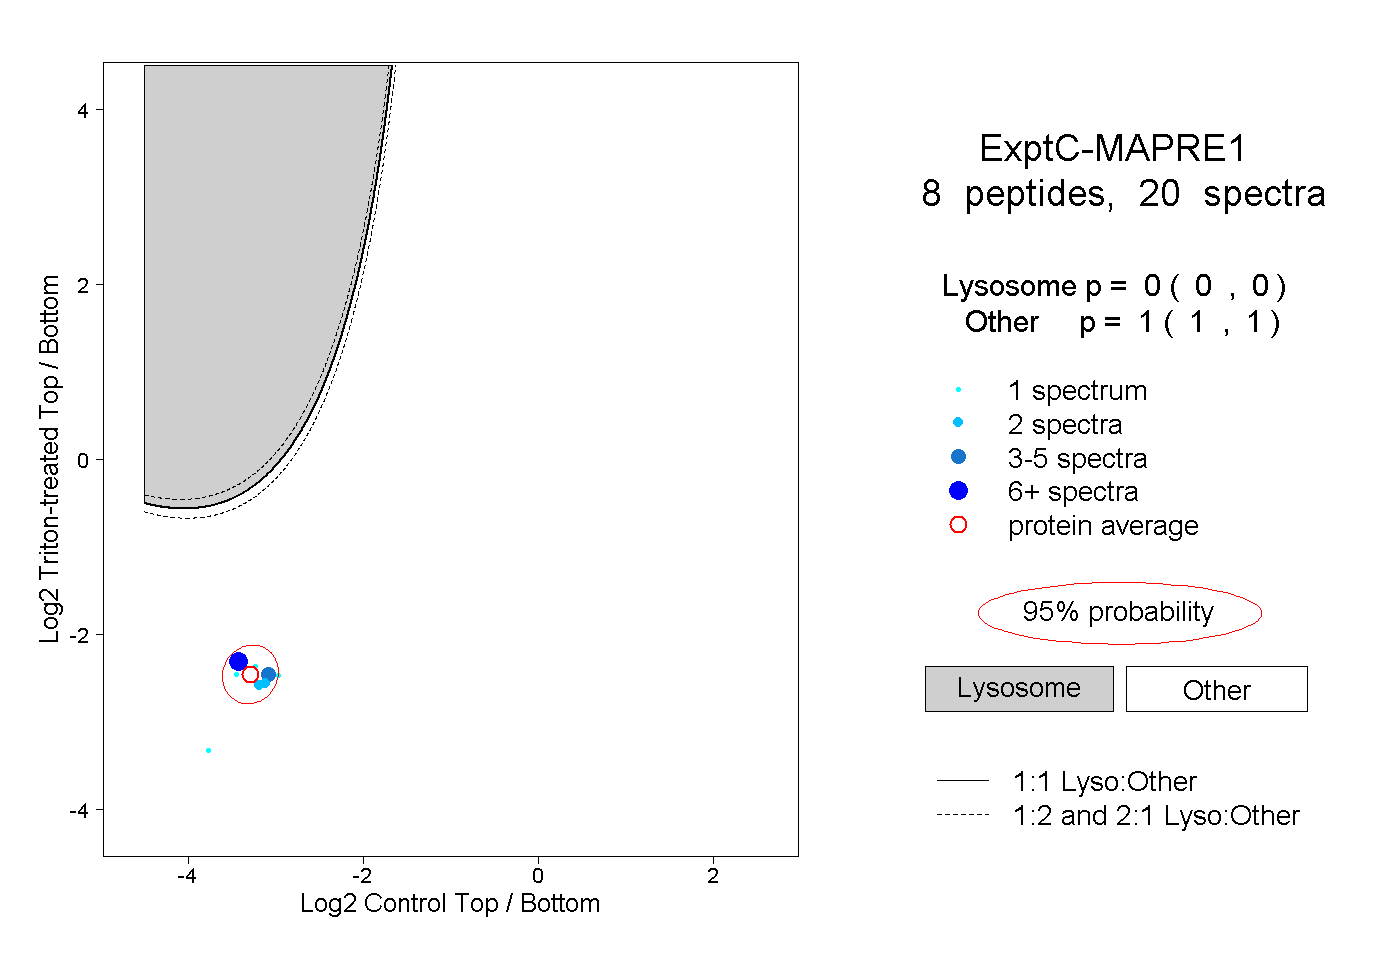 |
0.000 0.000 | 0.000 |
1.000 1.000 | 1.000 |
||||||||
| Plot | Lyso | Other | |||||||||||
| Expt D |
1 peptide |
1 spectrum |
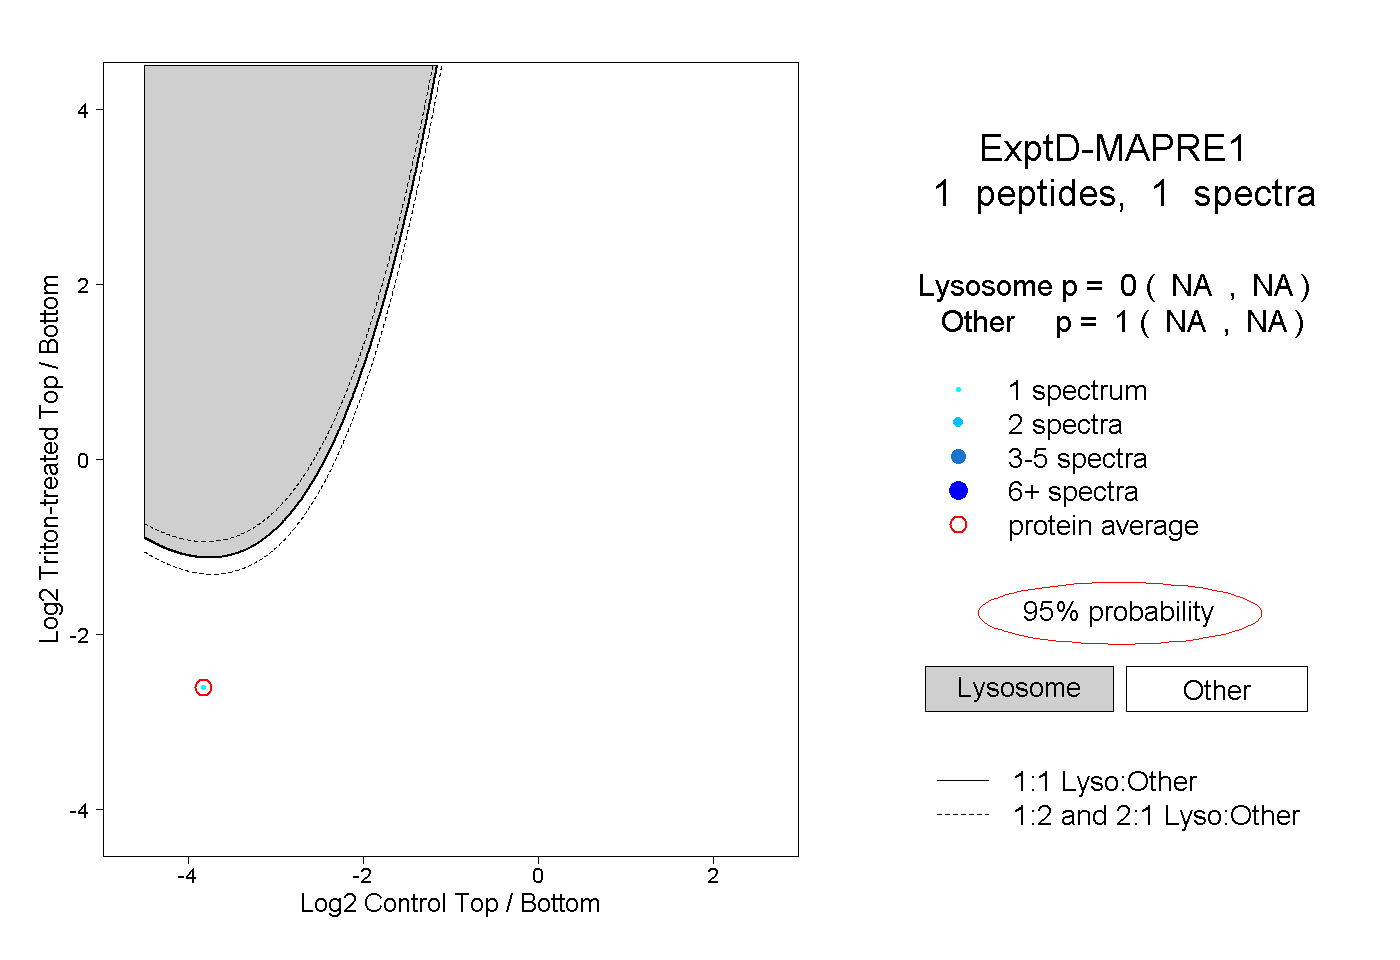 |
0.000 NA | NA |
1.000 NA | NA |