 33
33peptides
spectra
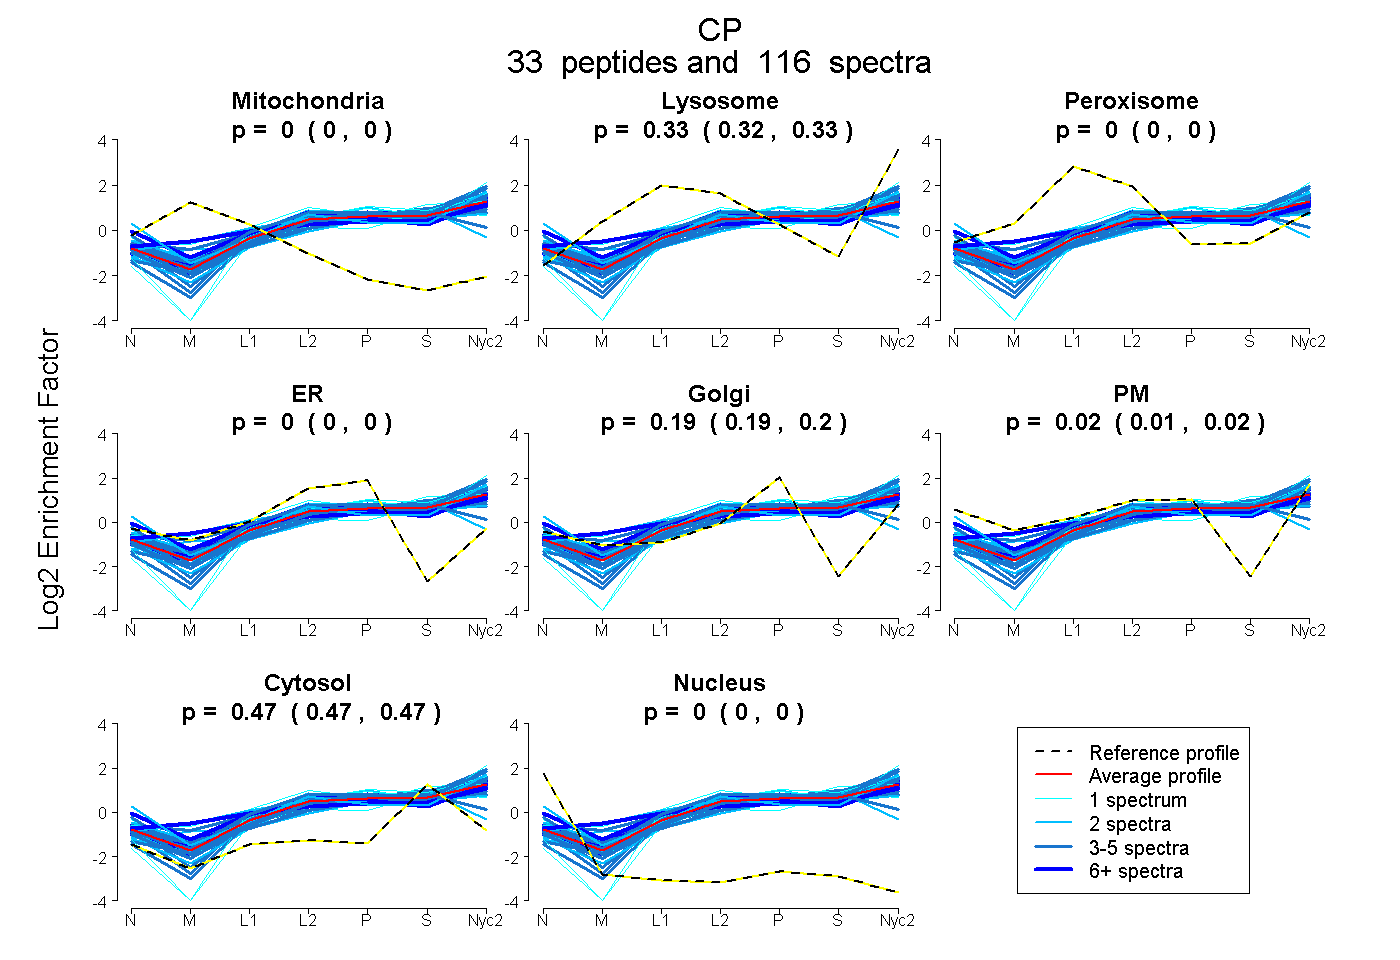
0.000 | 0.000
0.322 | 0.328
0.000 | 0.000
0.000 | 0.004
0.187 | 0.196
0.008 | 0.020
0.466 | 0.469
0.000 | 0.000
14peptides
spectra

0.000 | 0.000
0.287 | 0.317
0.047 | 0.106
0.190 | 0.241
0.000 | 0.000
0.387 | 0.408
0.000 | 0.000
35peptides
spectra
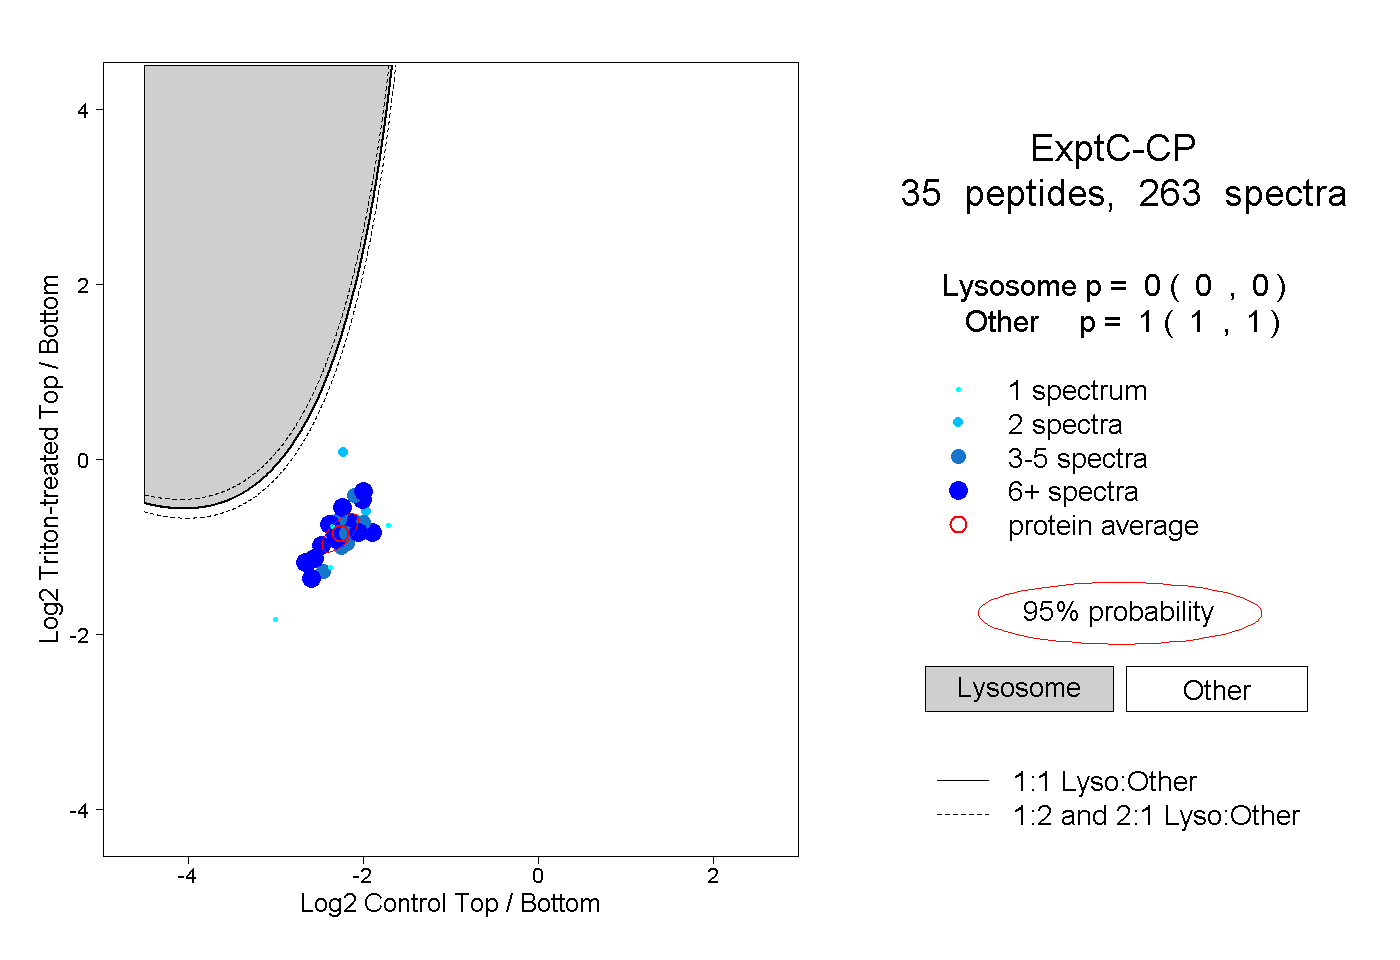
0.000 | 0.000
1.000 | 1.000
10peptides
spectra
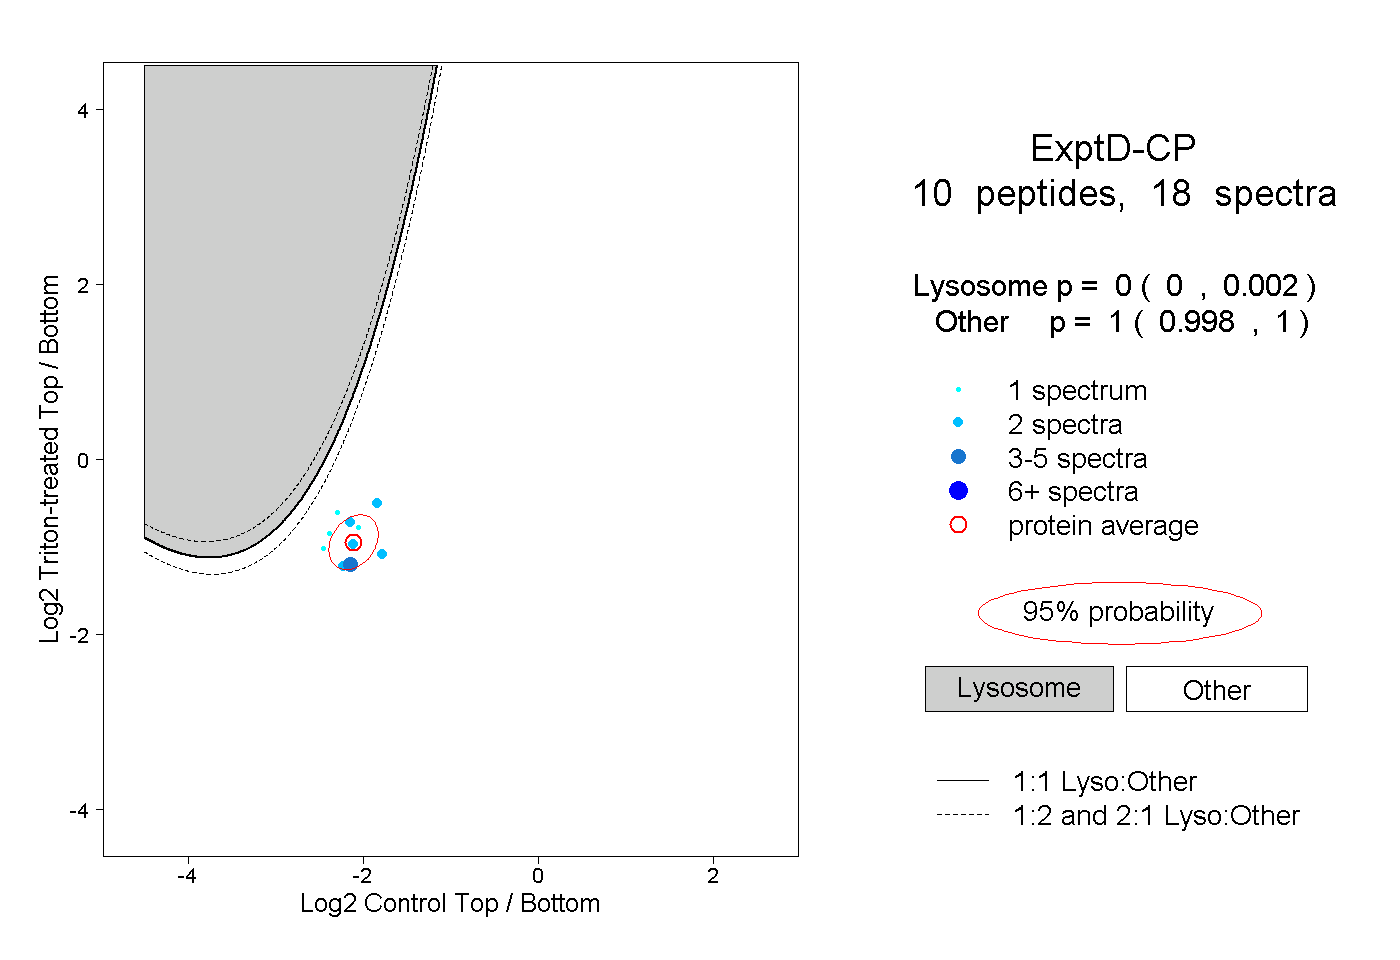
0.000 | 0.002
0.998 | 1.000