 6
6peptides
spectra
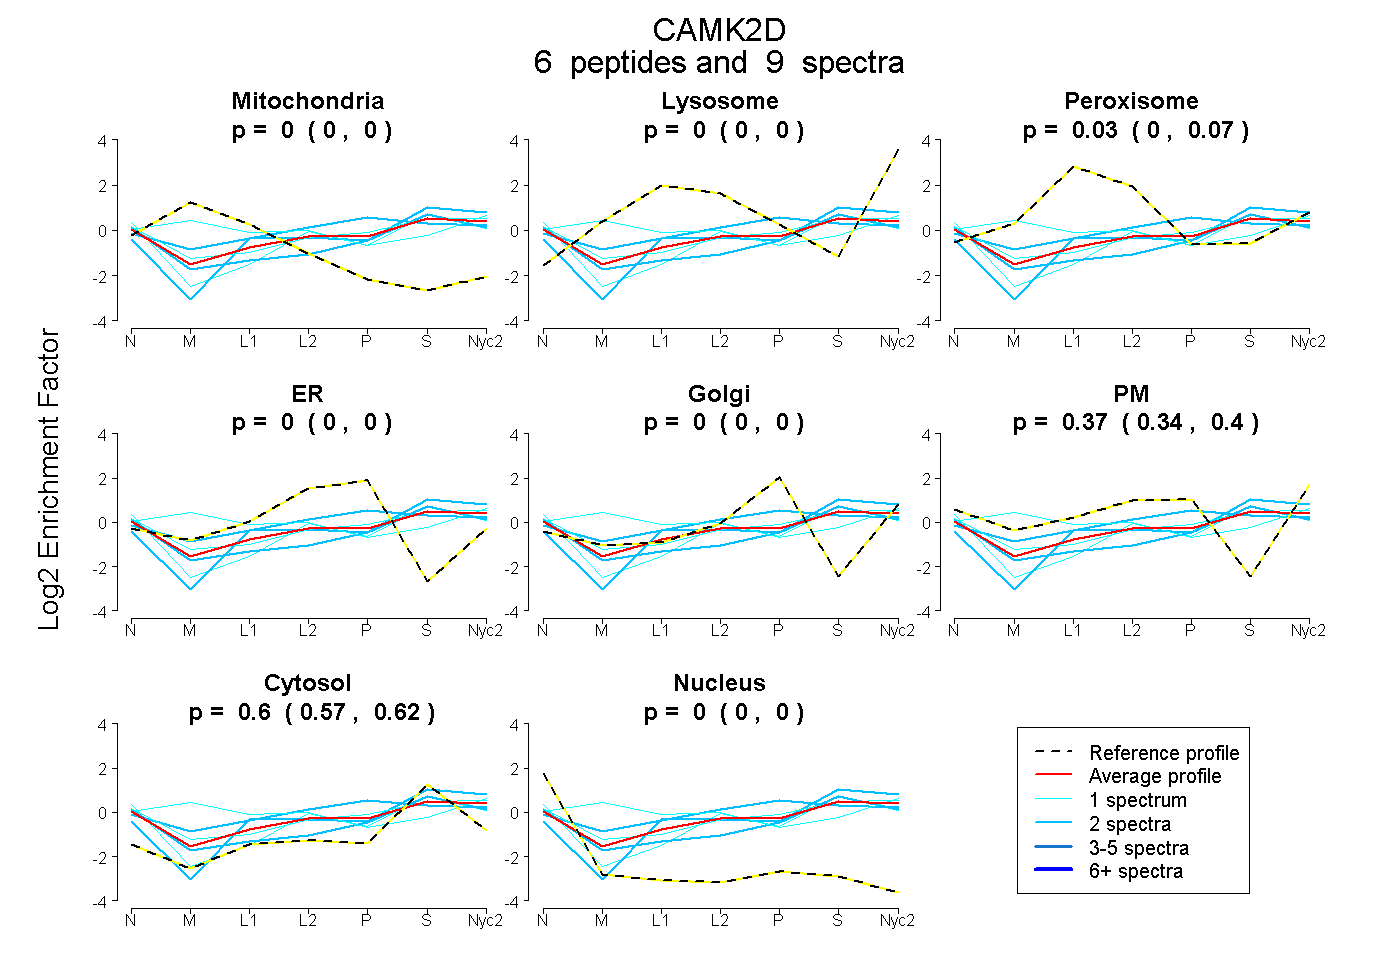
0.000 | 0.000
0.000 | 0.000
0.000 | 0.067
0.000 | 0.000
0.000 | 0.000
0.343 | 0.399
0.567 | 0.616
0.000 | 0.000
4peptides
spectra
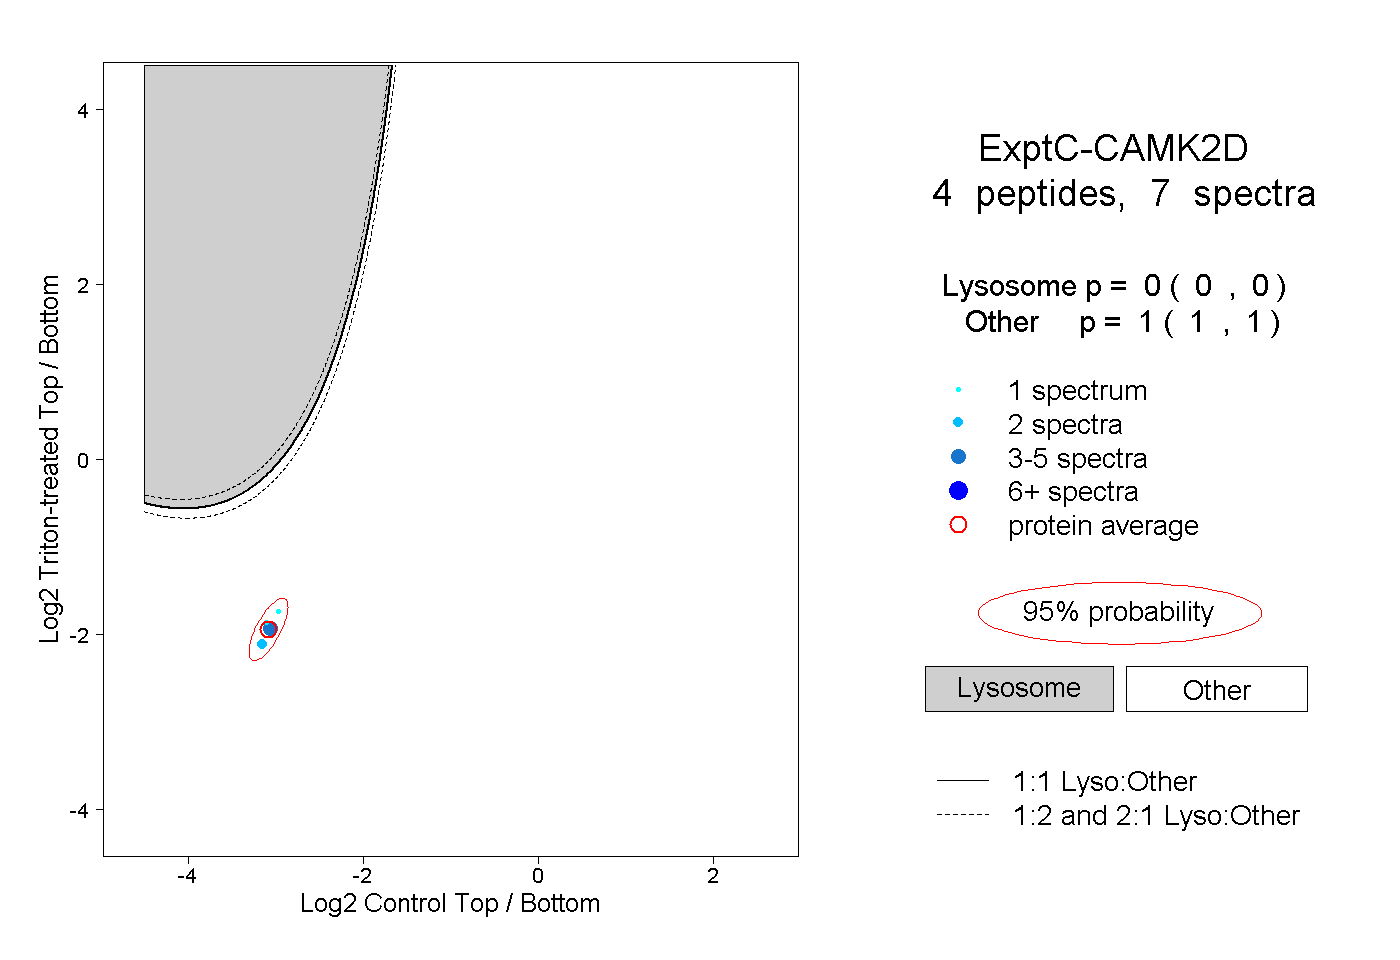
0.000 | 0.000
1.000 | 1.000
1peptide
spectrum
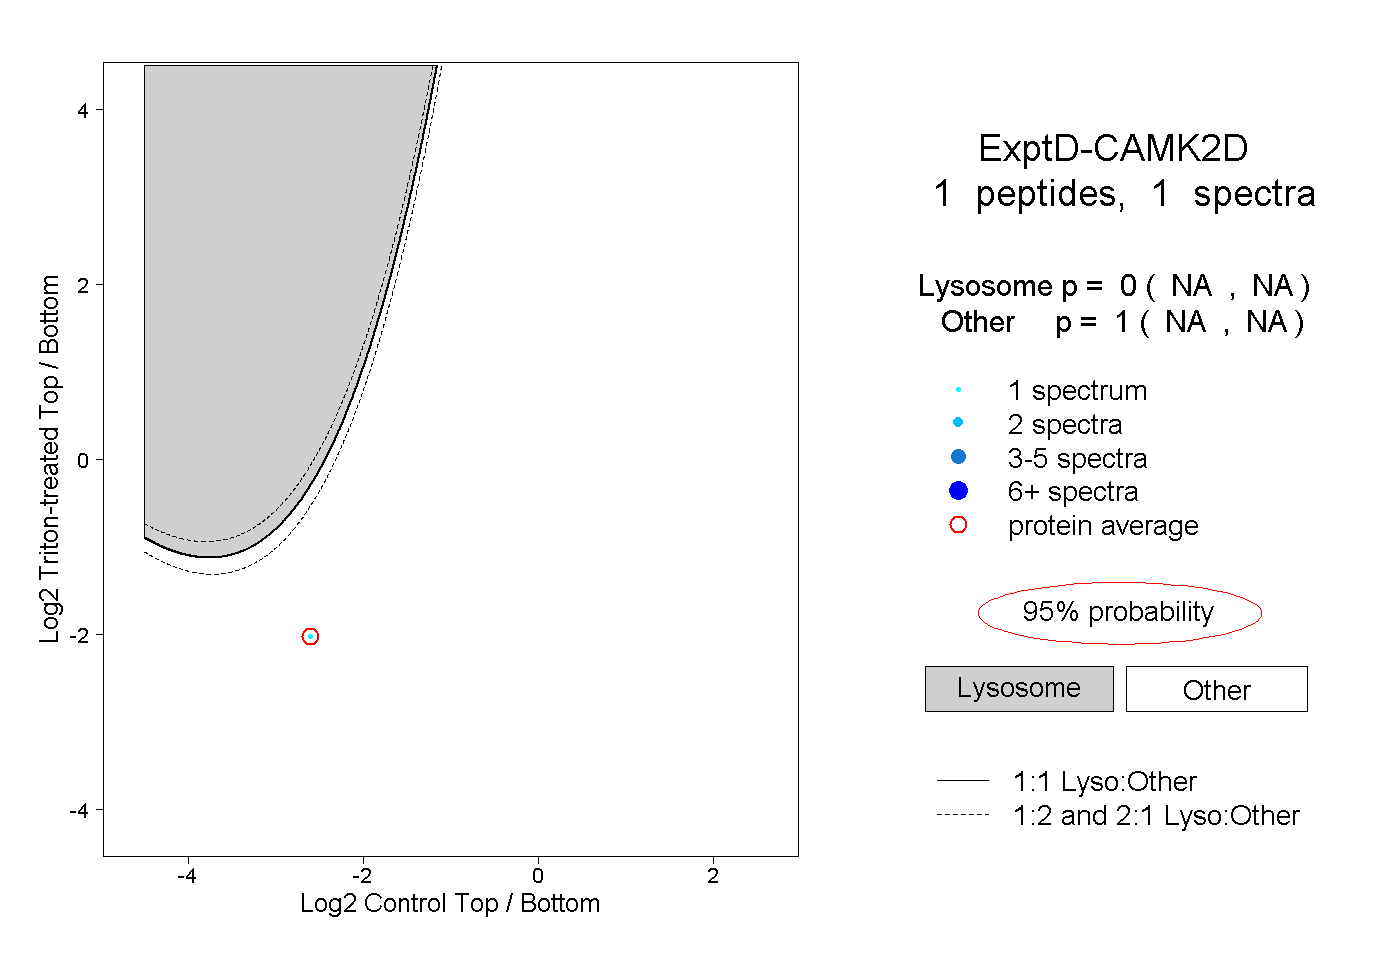
NA | NA
NA | NA