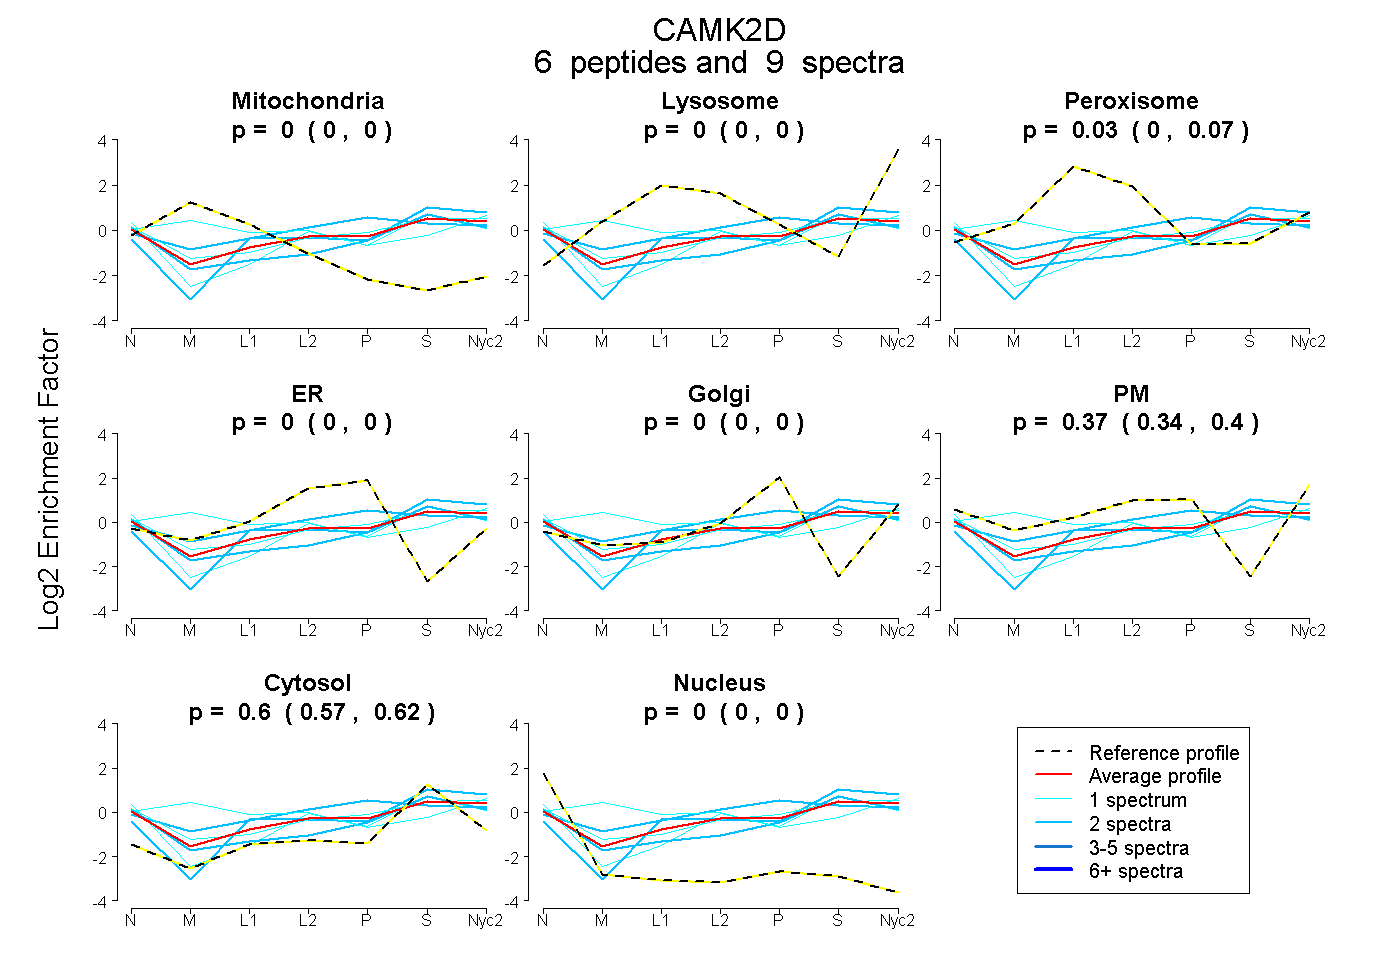
 6
6peptides
spectra
0.000 | 0.000
0.000 | 0.000
0.000 | 0.067
0.000 | 0.000
0.000 | 0.000
0.343 | 0.399
0.567 | 0.616
0.000 | 0.000
| Plot | Mito | Lyso | Perox | ER | Golgi | PM | Cytosol | Nucleus | |||||
| Expt A |
6 peptides |
9 spectra |
|
0.000 0.000 | 0.000 |
0.000 0.000 | 0.000 |
0.031 0.000 | 0.067 |
0.000 0.000 | 0.000 |
0.000 0.000 | 0.000 |
0.374 0.343 | 0.399 |
0.595 0.567 | 0.616 |
0.000 0.000 | 0.000 |
| 1 spectrum, ASTTTCTR | 0.000 | 0.000 | 0.000 | 0.000 | 0.000 | 0.290 | 0.683 | 0.028 | ||
| 1 spectrum, IPTGQEYAAK | 0.228 | 0.181 | 0.087 | 0.000 | 0.000 | 0.220 | 0.284 | 0.000 | ||
| 1 spectrum, LYGAQIK | 0.000 | 0.000 | 0.000 | 0.000 | 0.000 | 0.429 | 0.571 | 0.000 | ||
| 2 spectra, HPWICQR | 0.000 | 0.000 | 0.189 | 0.000 | 0.198 | 0.199 | 0.414 | 0.000 | ||
| 2 spectra, GAILTTMLATR | 0.000 | 0.148 | 0.000 | 0.000 | 0.000 | 0.140 | 0.712 | 0.000 | ||
| 2 spectra, GAFSVVR | 0.000 | 0.000 | 0.000 | 0.000 | 0.000 | 0.286 | 0.681 | 0.033 |
| Plot | Lyso | Other | |||||||||||
| Expt C |
4 peptides |
7 spectra |
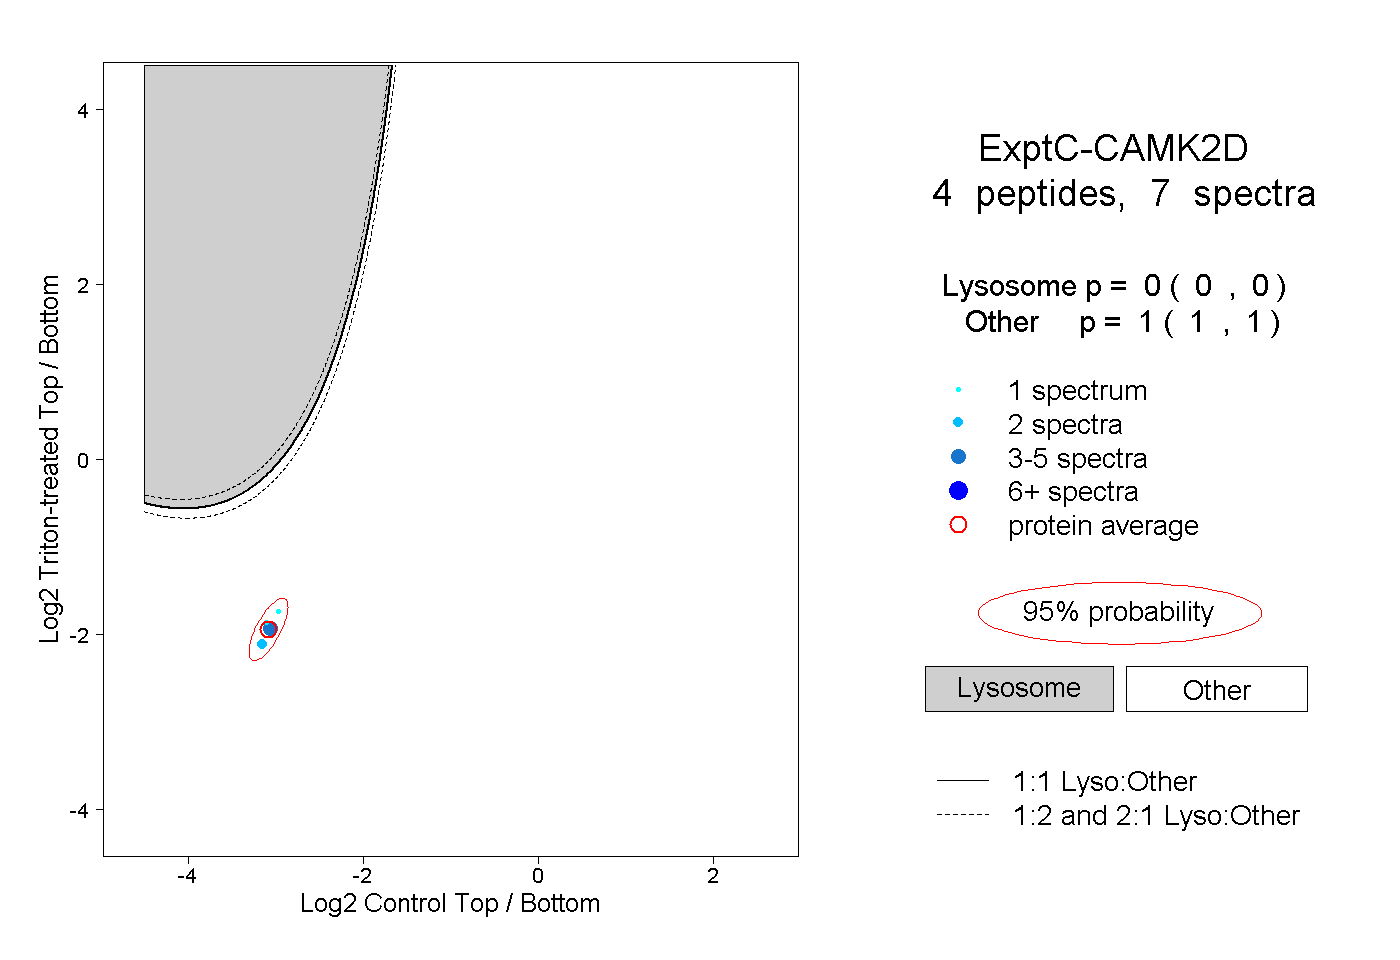 |
0.000 0.000 | 0.000 |
1.000 1.000 | 1.000 |
||||||||
| Plot | Lyso | Other | |||||||||||
| Expt D |
1 peptide |
1 spectrum |
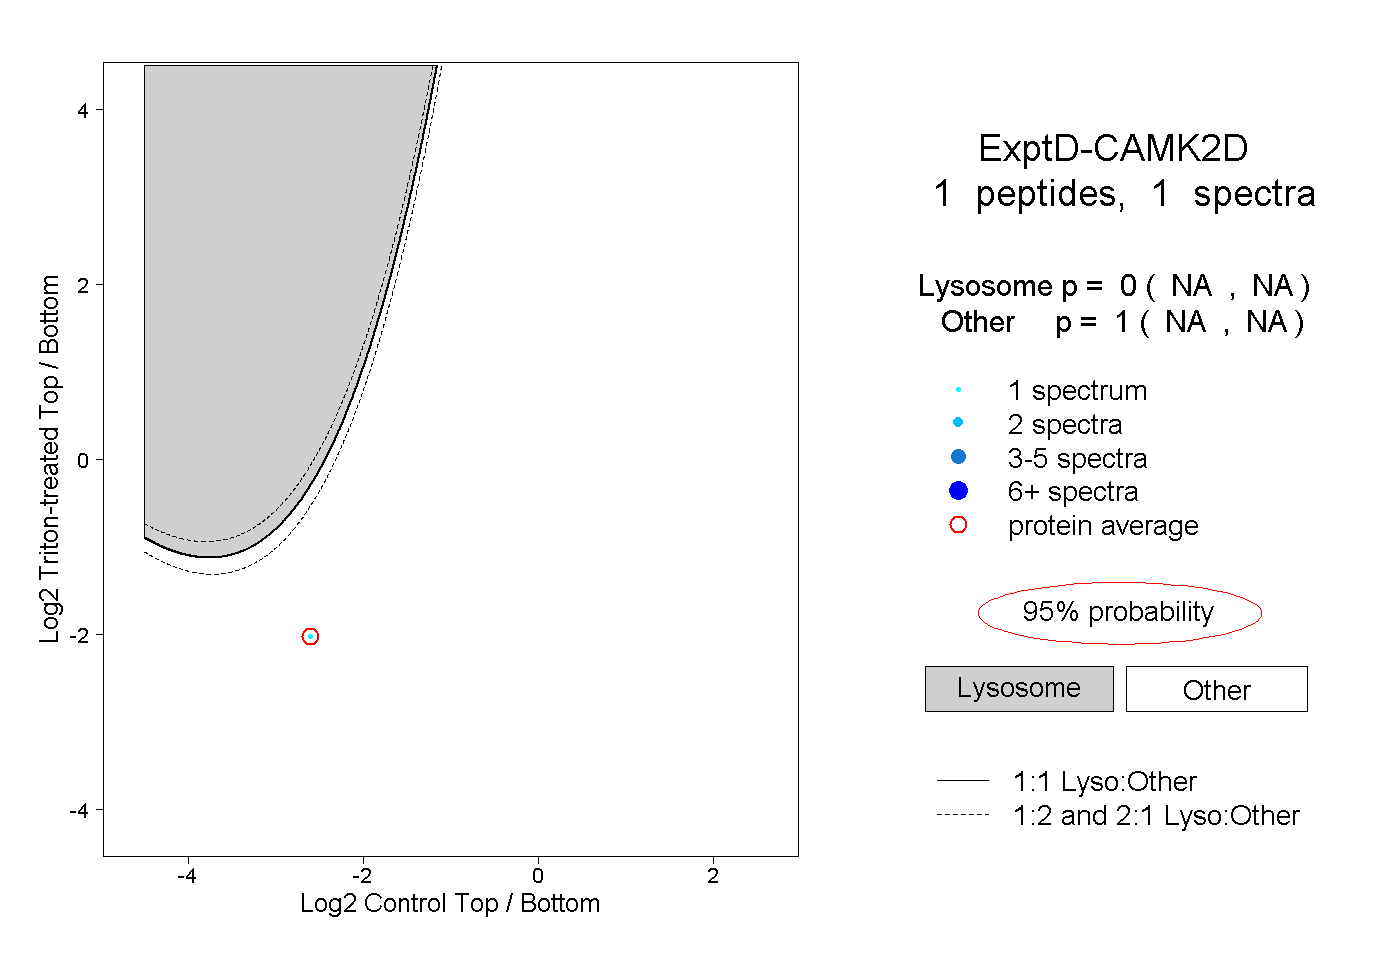 |
0.000 NA | NA |
1.000 NA | NA |