 4
4peptides
spectra
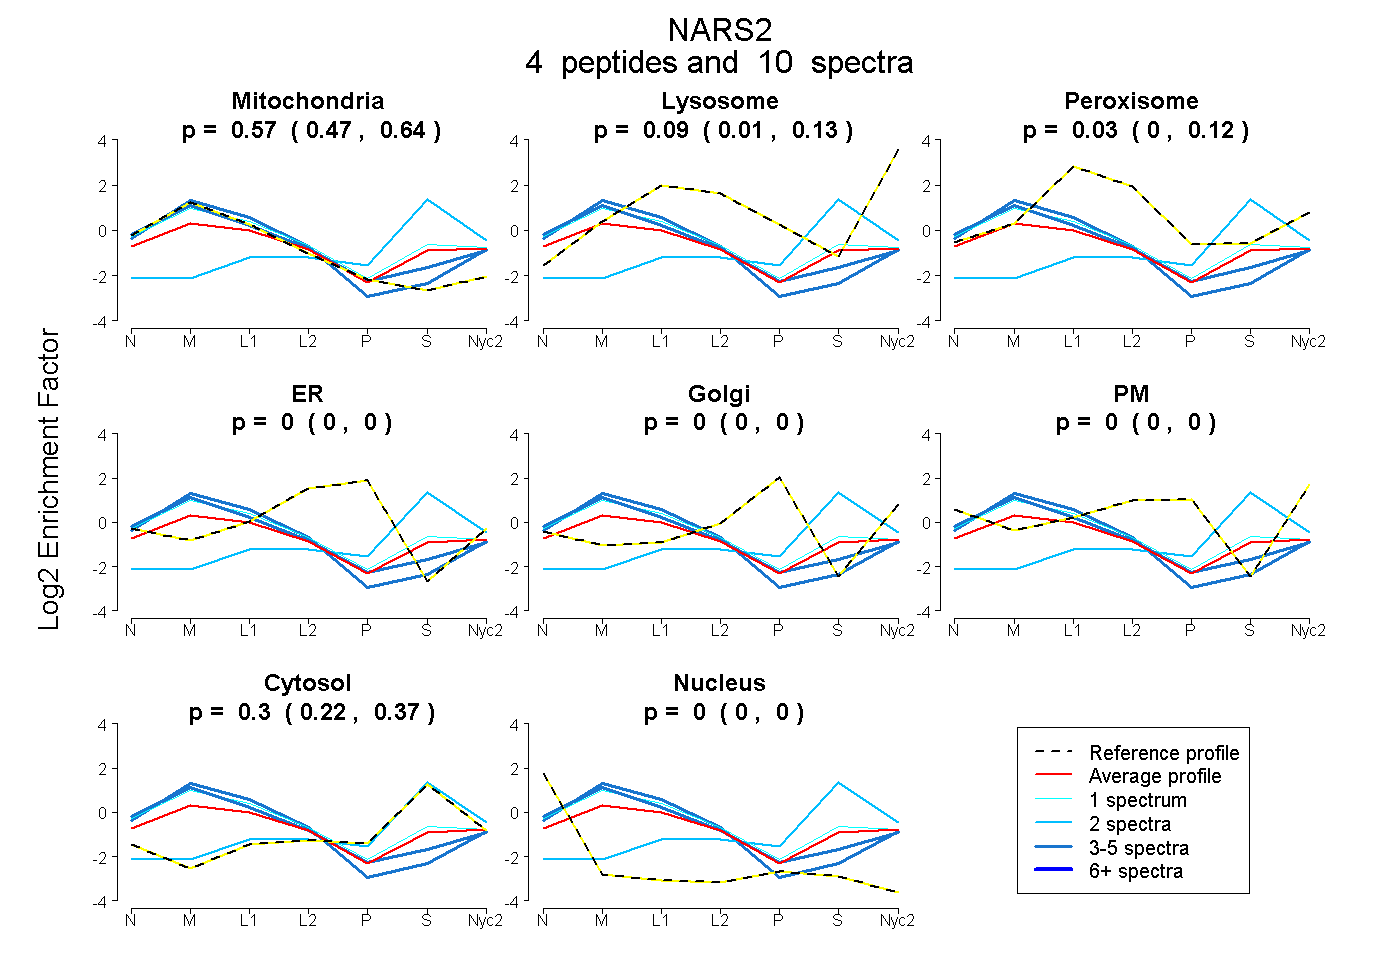
0.473 | 0.635
0.014 | 0.127
0.000 | 0.122
0.000 | 0.000
0.000 | 0.000
0.000 | 0.000
0.222 | 0.372
0.000 | 0.000
6peptides
spectra
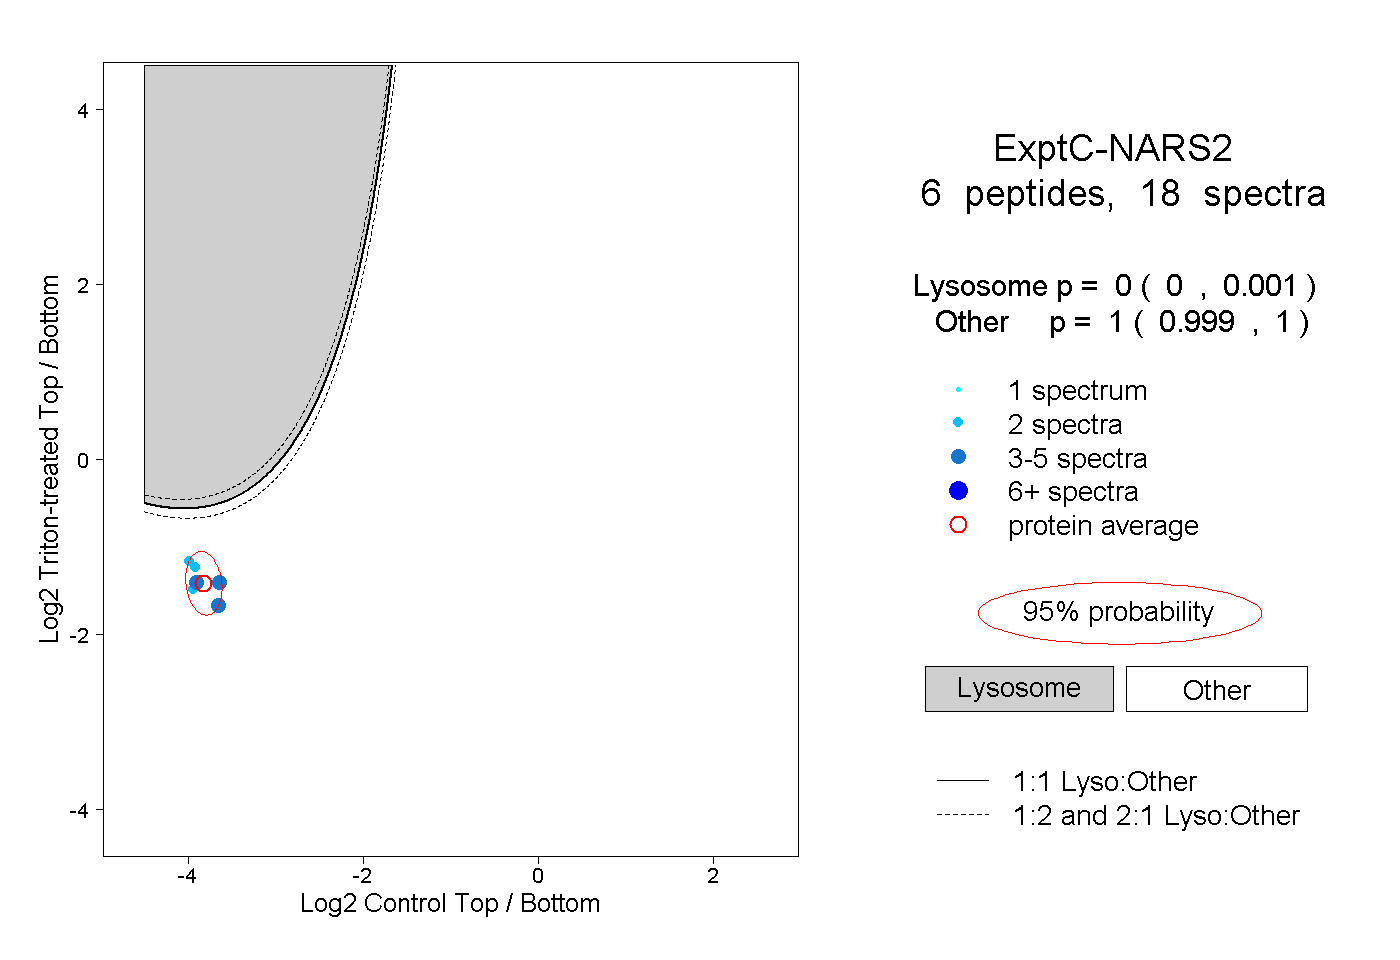
0.000 | 0.001
0.999 | 1.000
1peptide
spectra
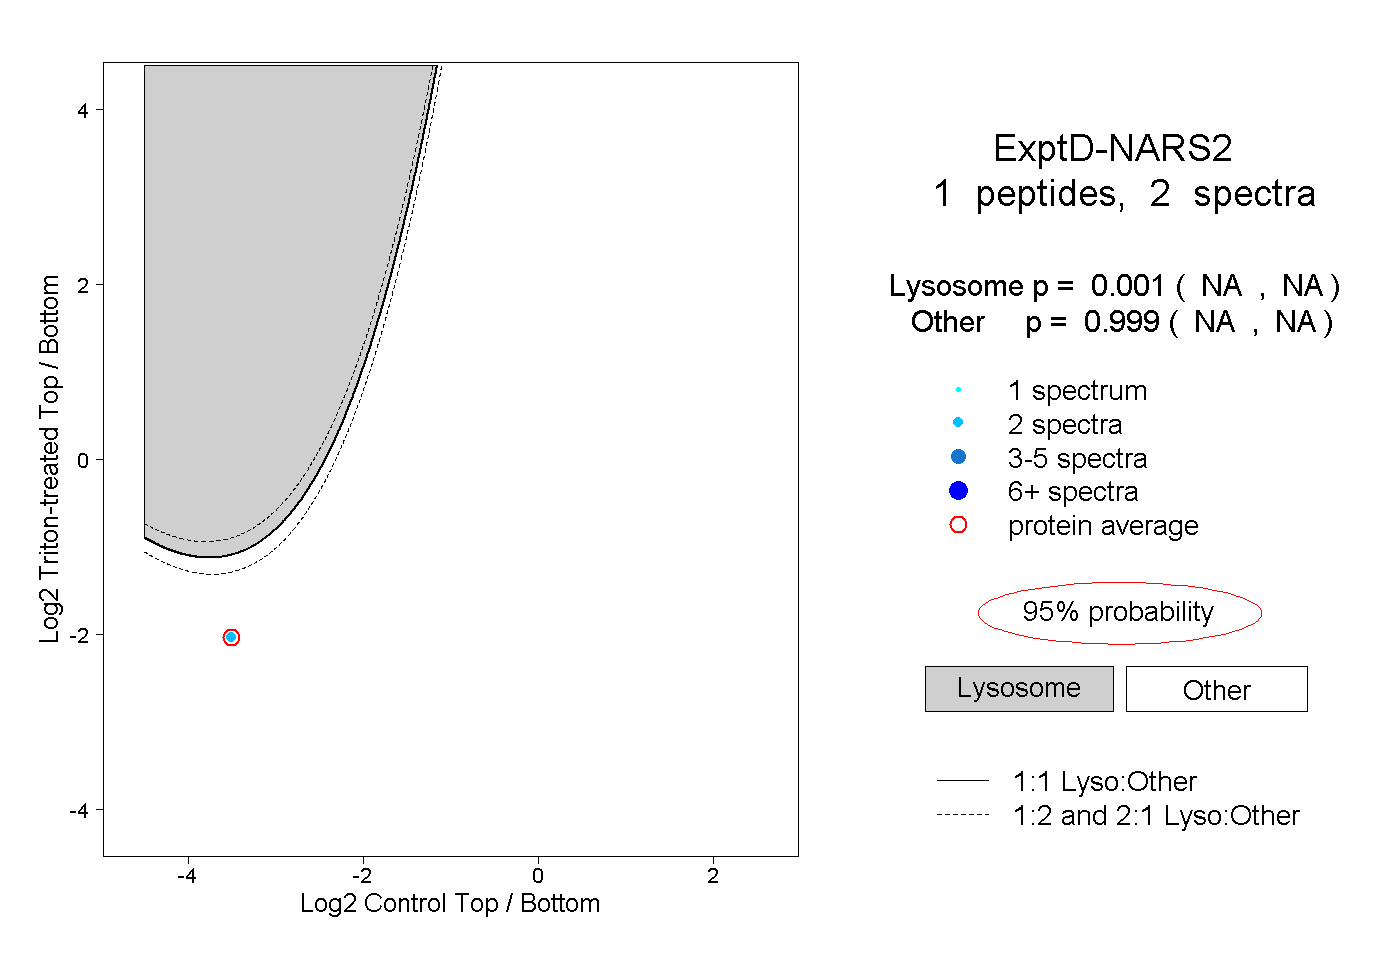
NA | NA
NA | NA