 4
4peptides
spectra
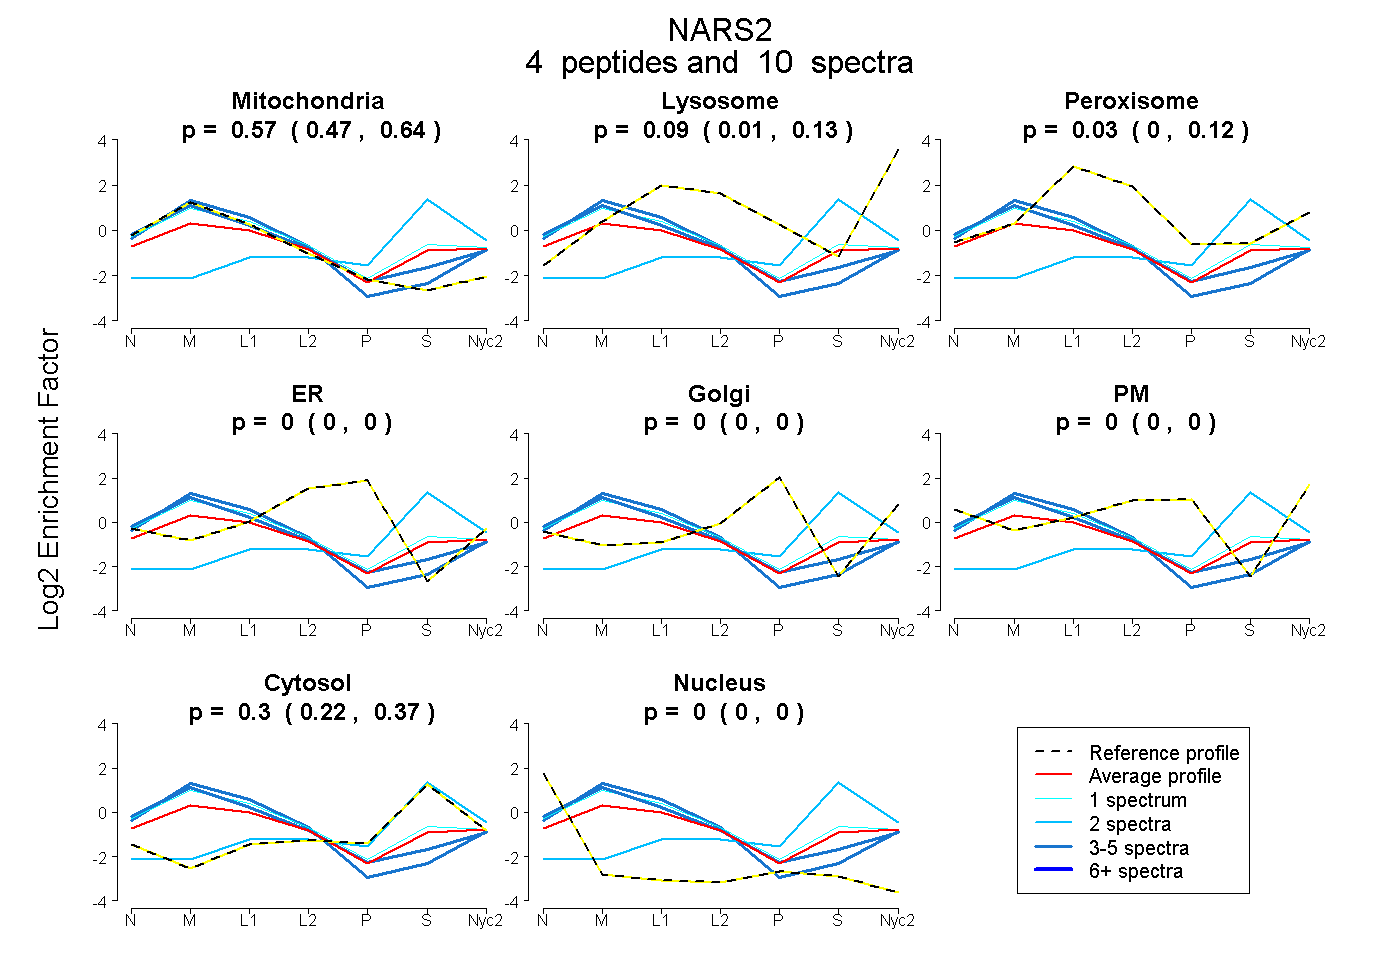
0.473 | 0.635
0.014 | 0.127
0.000 | 0.122
0.000 | 0.000
0.000 | 0.000
0.000 | 0.000
0.222 | 0.372
0.000 | 0.000
| Plot | Mito | Lyso | Perox | ER | Golgi | PM | Cytosol | Nucleus | |||||
| Expt A |
4 peptides |
10 spectra |
|
0.572 0.473 | 0.635 |
0.094 0.014 | 0.127 |
0.030 0.000 | 0.122 |
0.000 0.000 | 0.000 |
0.000 0.000 | 0.000 |
0.000 0.000 | 0.000 |
0.304 0.222 | 0.372 |
0.000 0.000 | 0.000 |
| 4 spectra, TNALGSILR | 0.768 | 0.120 | 0.010 | 0.000 | 0.000 | 0.000 | 0.102 | 0.000 | ||
| 3 spectra, HPLEYLR | 0.870 | 0.130 | 0.000 | 0.000 | 0.000 | 0.000 | 0.000 | 0.000 | ||
| 2 spectra, MLGAR | 0.000 | 0.060 | 0.000 | 0.000 | 0.000 | 0.000 | 0.940 | 0.000 | ||
| 1 spectrum, SEATAAIHSYFK | 0.565 | 0.011 | 0.215 | 0.000 | 0.000 | 0.000 | 0.209 | 0.000 |
| Plot | Lyso | Other | |||||||||||
| Expt C |
6 peptides |
18 spectra |
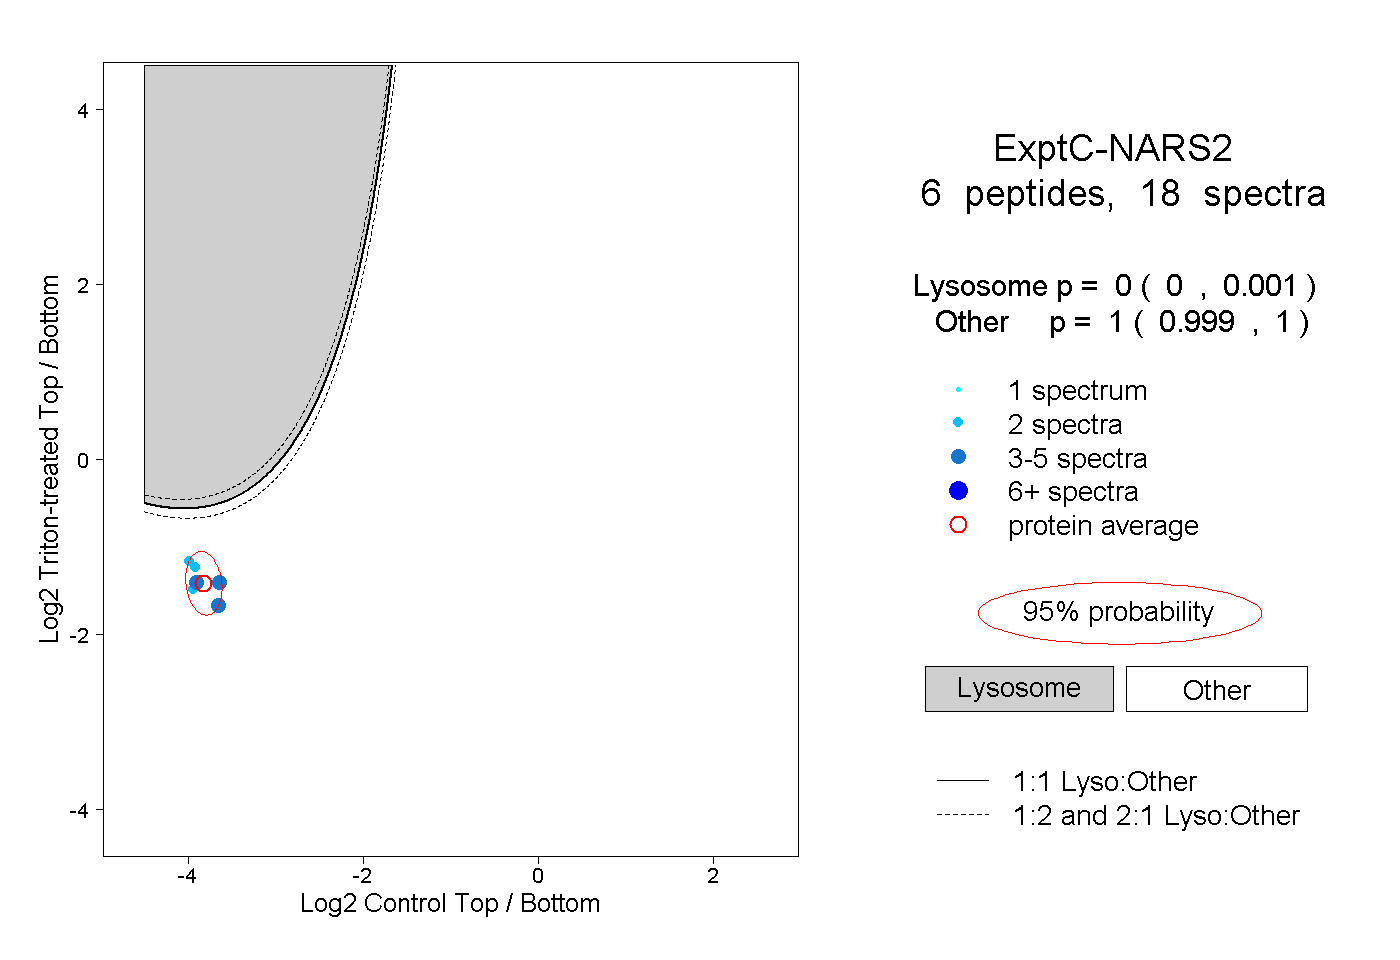 |
0.000 0.000 | 0.001 |
1.000 0.999 | 1.000 |
||||||||
| Plot | Lyso | Other | |||||||||||
| Expt D |
1 peptide |
2 spectra |
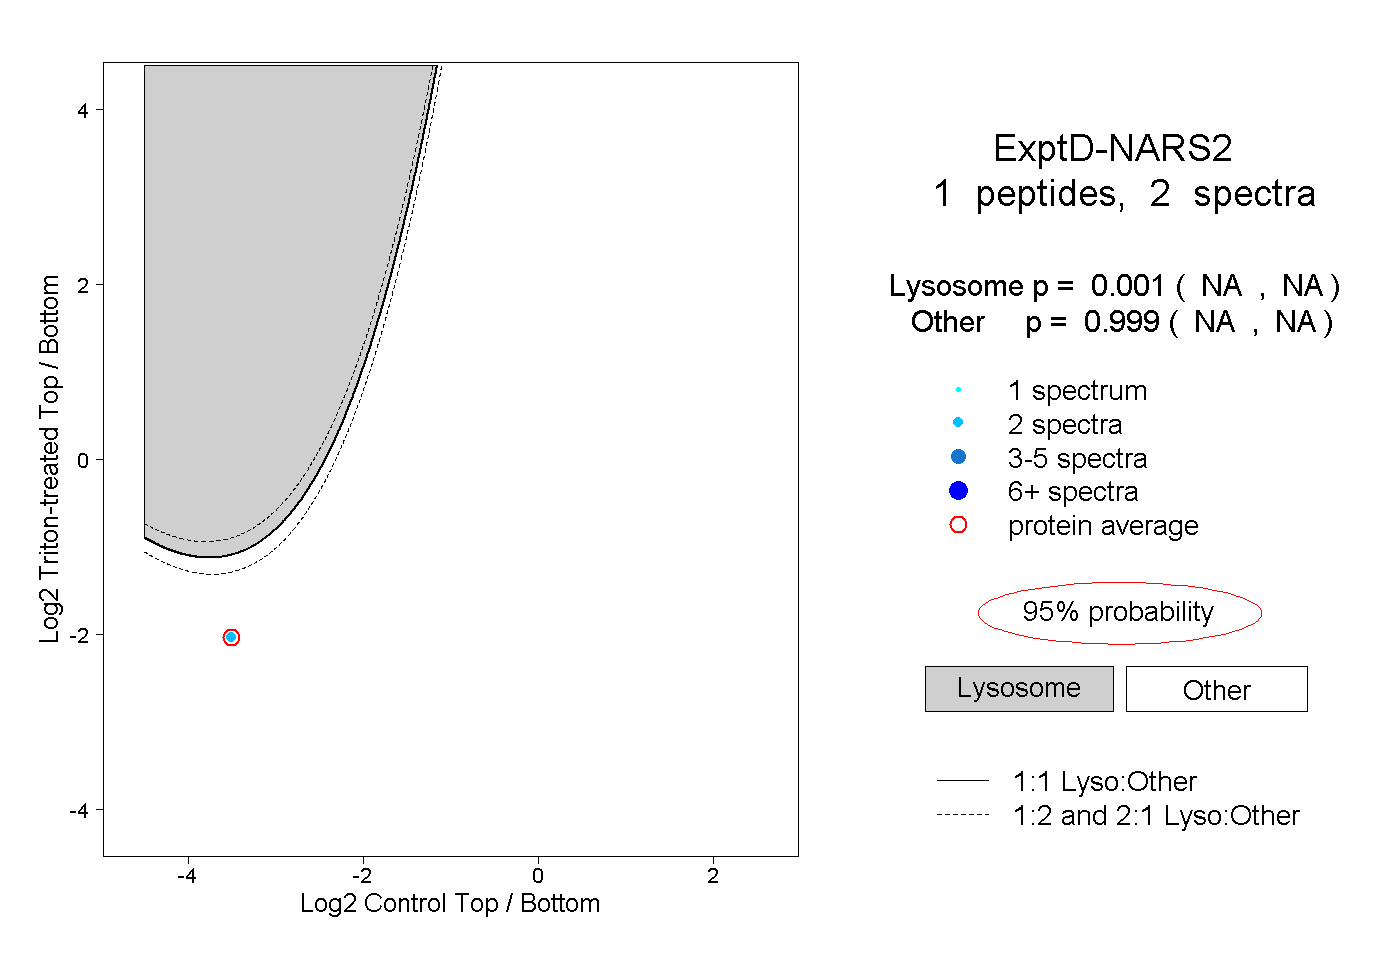 |
0.001 NA | NA |
0.999 NA | NA |