 4
4peptides
spectra
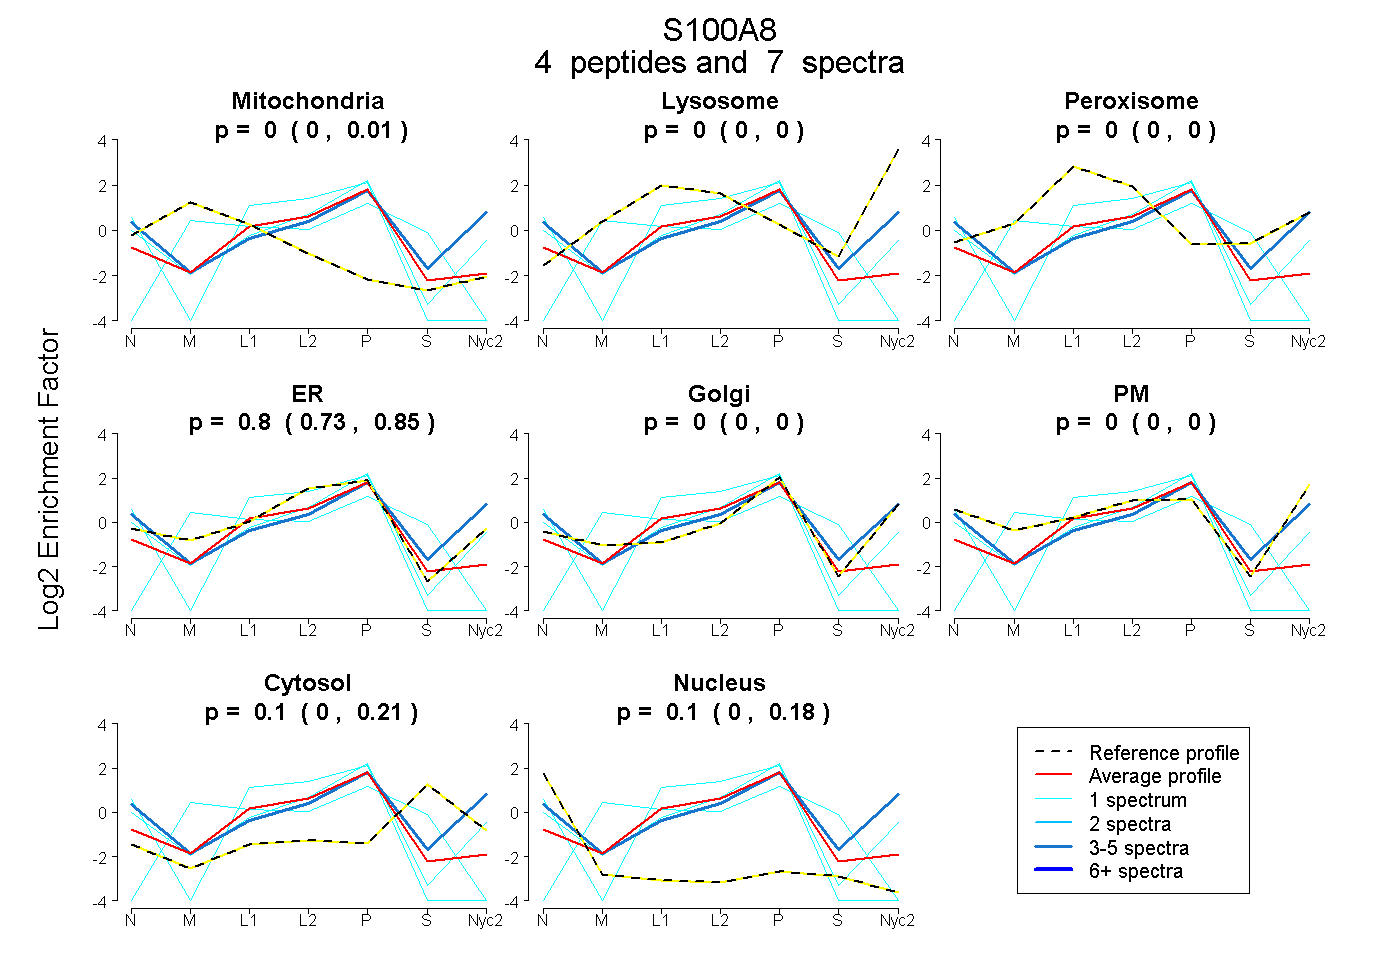
0.000 | 0.014
0.000 | 0.000
0.000 | 0.000
0.728 | 0.848
0.000 | 0.000
0.000 | 0.000
0.000 | 0.207
0.000 | 0.181
2peptides
spectra
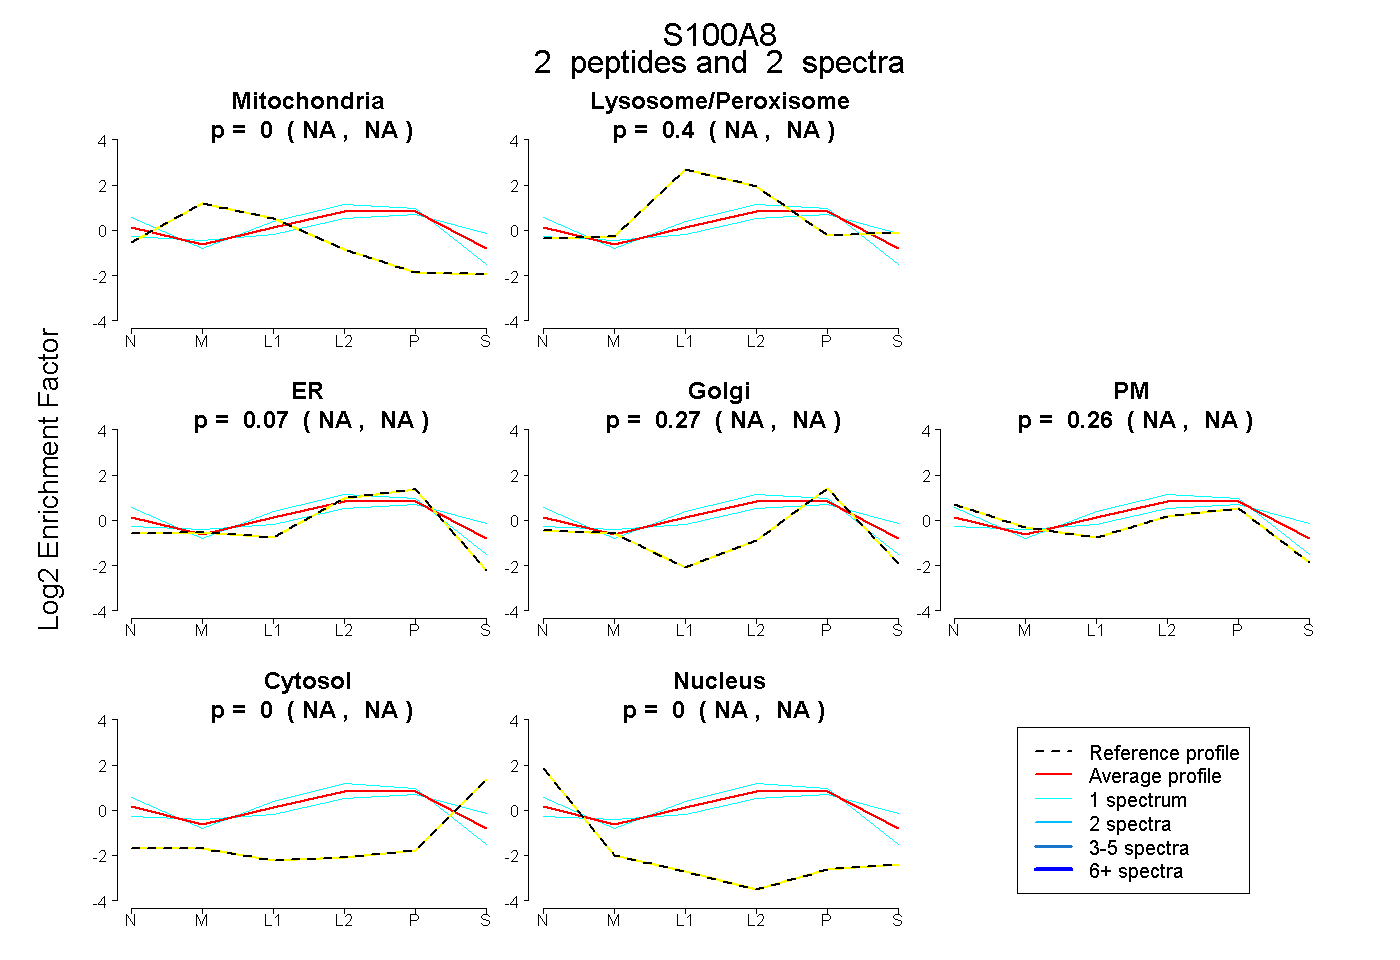
NA | NA
NA | NA
NA | NA
NA | NA
NA | NA
NA | NA
NA | NA
4peptides
spectra
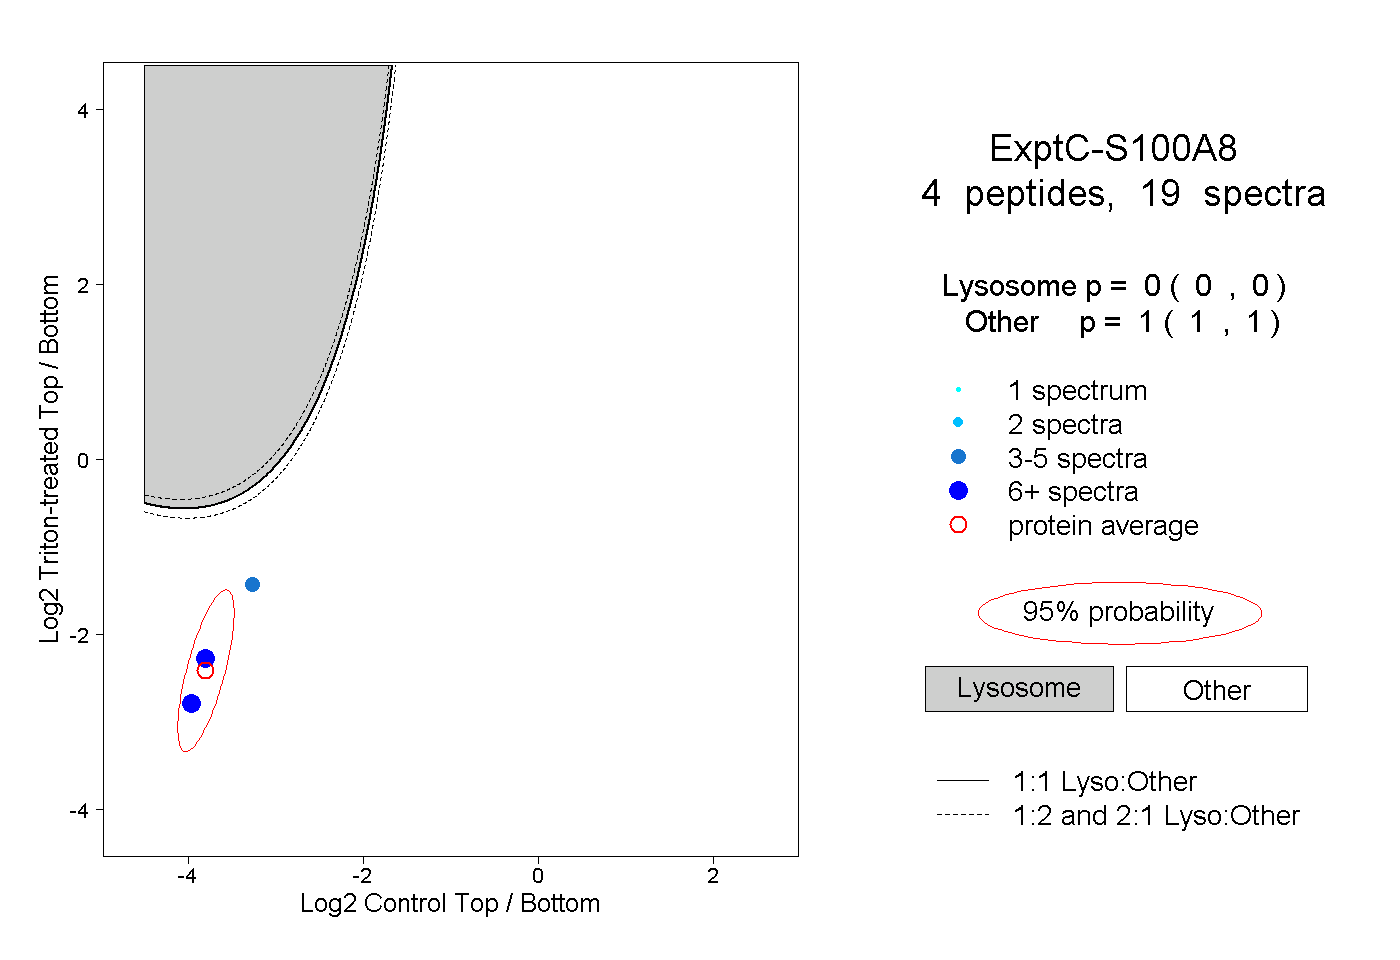
0.000 | 0.000
1.000 | 1.000