 4
4peptides
spectra
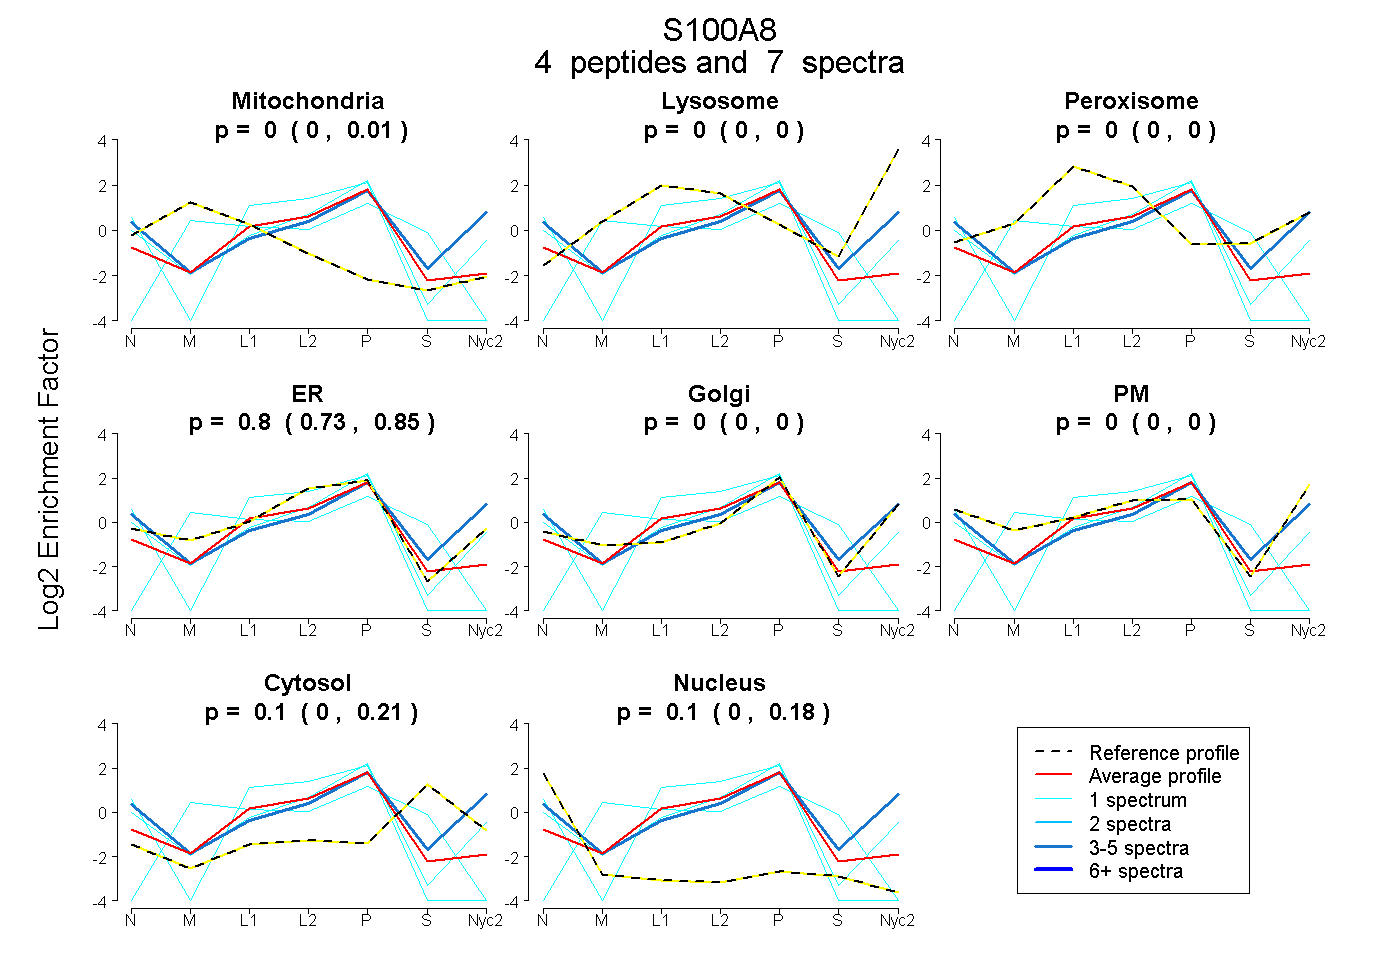
0.000 | 0.014
0.000 | 0.000
0.000 | 0.000
0.728 | 0.848
0.000 | 0.000
0.000 | 0.000
0.000 | 0.207
0.000 | 0.181
2peptides
spectra
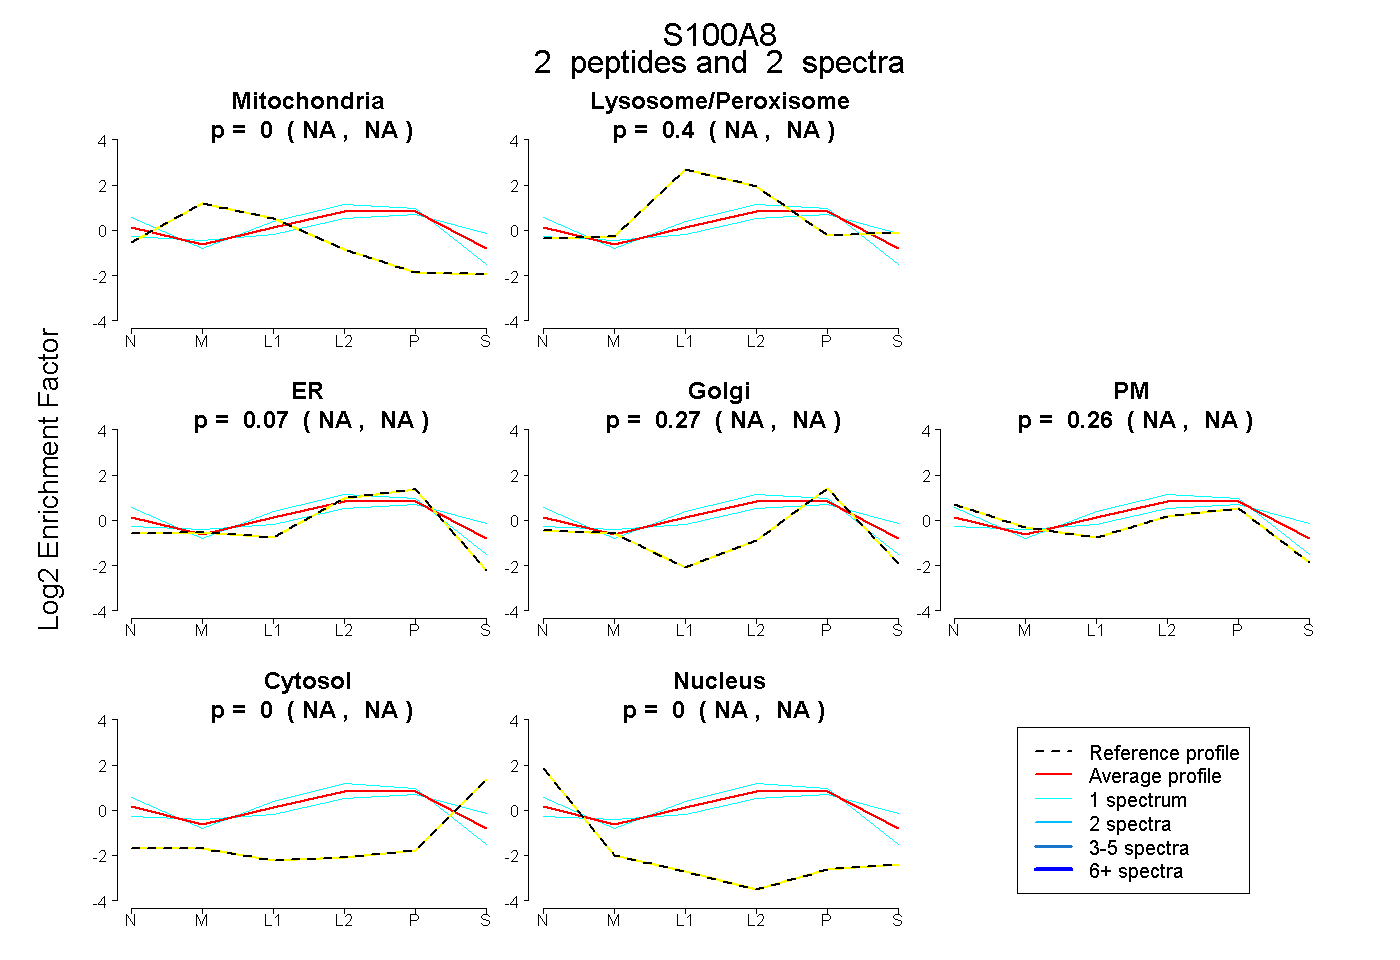
NA | NA
NA | NA
NA | NA
NA | NA
NA | NA
NA | NA
NA | NA
| Plot | Mito | Lyso | Perox | ER | Golgi | PM | Cytosol | Nucleus | |||||
| Expt A |
4 peptides |
7 spectra |
|
0.000 0.000 | 0.014 |
0.000 0.000 | 0.000 |
0.000 0.000 | 0.000 |
0.799 0.728 | 0.848 |
0.000 0.000 | 0.000 |
0.000 0.000 | 0.000 |
0.098 0.000 | 0.207 |
0.103 0.000 | 0.181 |
||
| Plot | Mito | Lyso or Perox | ER | Golgi | PM | Cytosol | Nucleus | ||||||
| Expt B |
2 peptides |
2 spectra |
|
0.000 NA | NA |
0.401 NA | NA |
0.068 NA | NA |
0.275 NA | NA |
0.256 NA | NA |
0.000 NA | NA |
0.000 NA | NA |
| 1 spectrum, NTESLFK | 0.000 | 0.456 | 0.000 | 0.436 | 0.000 | 0.109 | 0.000 | |||
| 1 spectrum, VGVAAHK | 0.000 | 0.294 | 0.285 | 0.000 | 0.421 | 0.000 | 0.000 |
| Plot | Lyso | Other | |||||||||||
| Expt C |
4 peptides |
19 spectra |
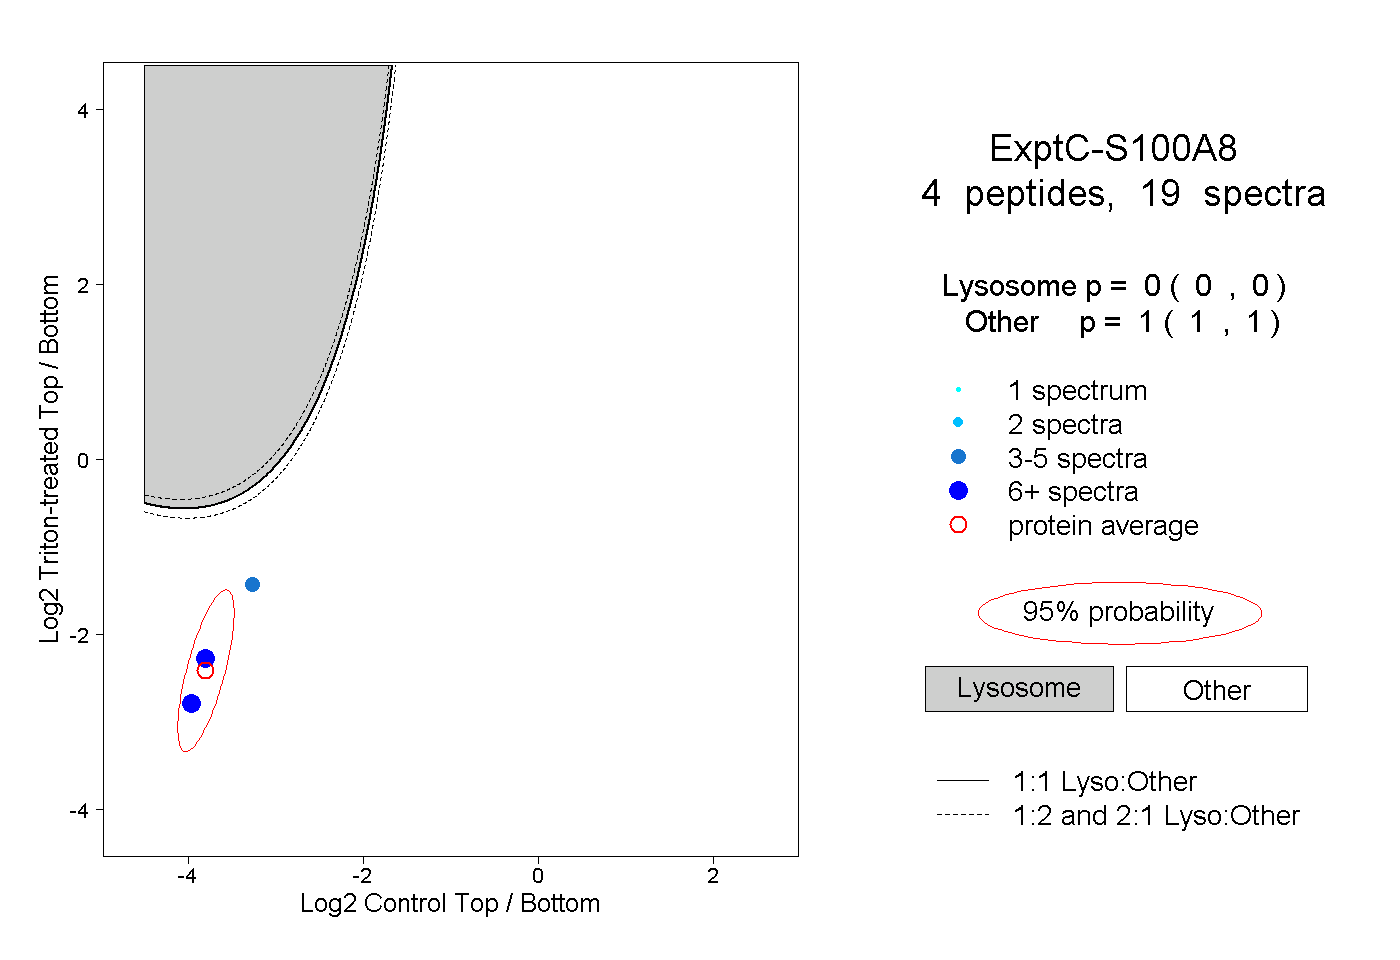 |
0.000 0.000 | 0.000 |
1.000 1.000 | 1.000 |