 42
42peptides
spectra
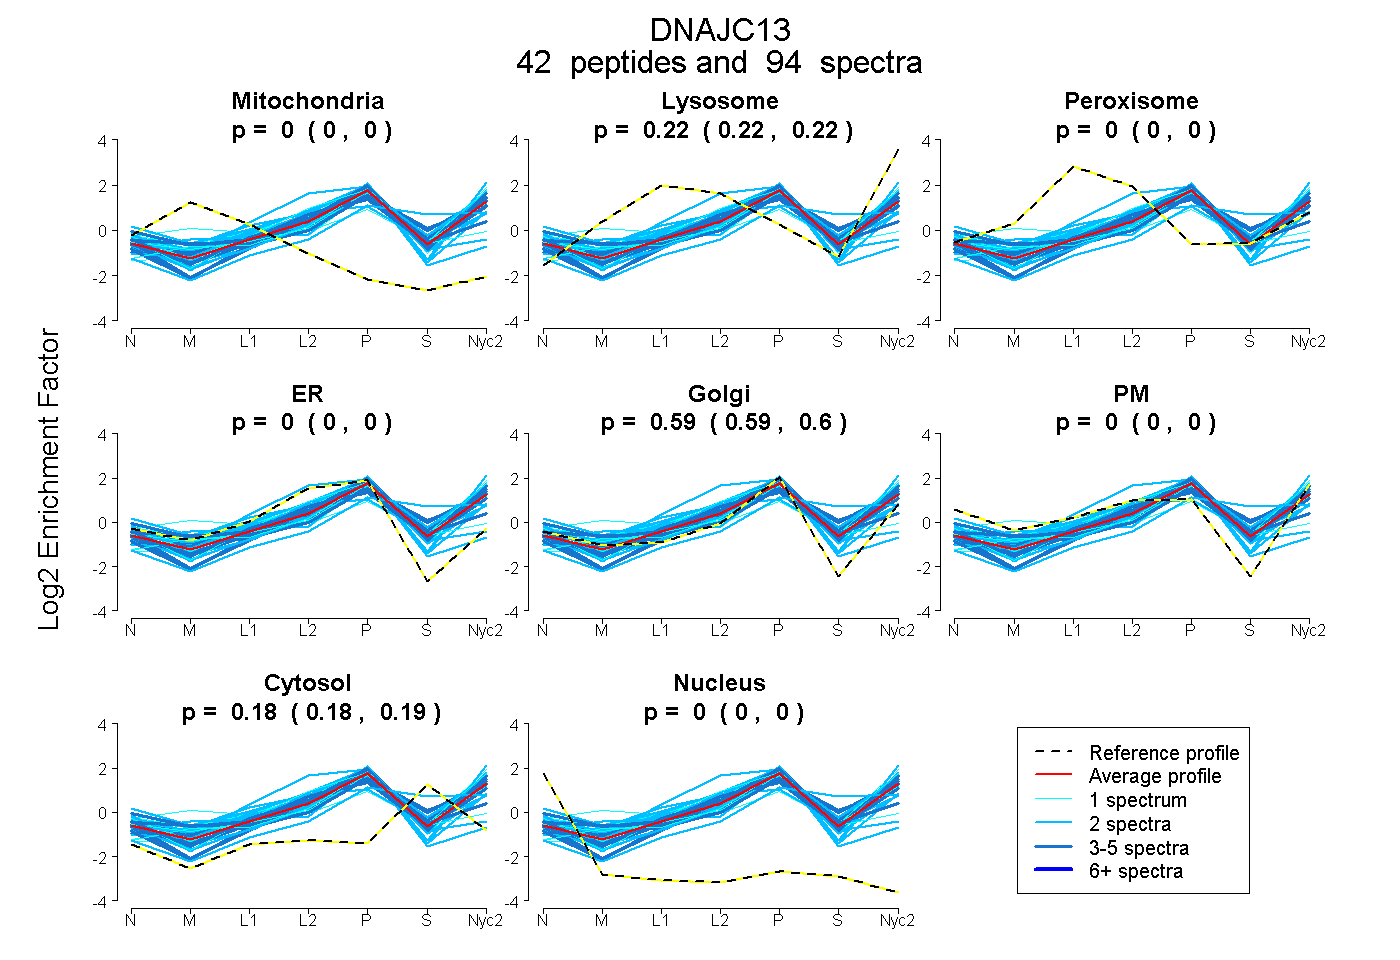
0.000 | 0.000
0.219 | 0.224
0.000 | 0.000
0.000 | 0.000
0.591 | 0.596
0.000 | 0.000
0.182 | 0.186
0.000 | 0.000
7peptides
spectra
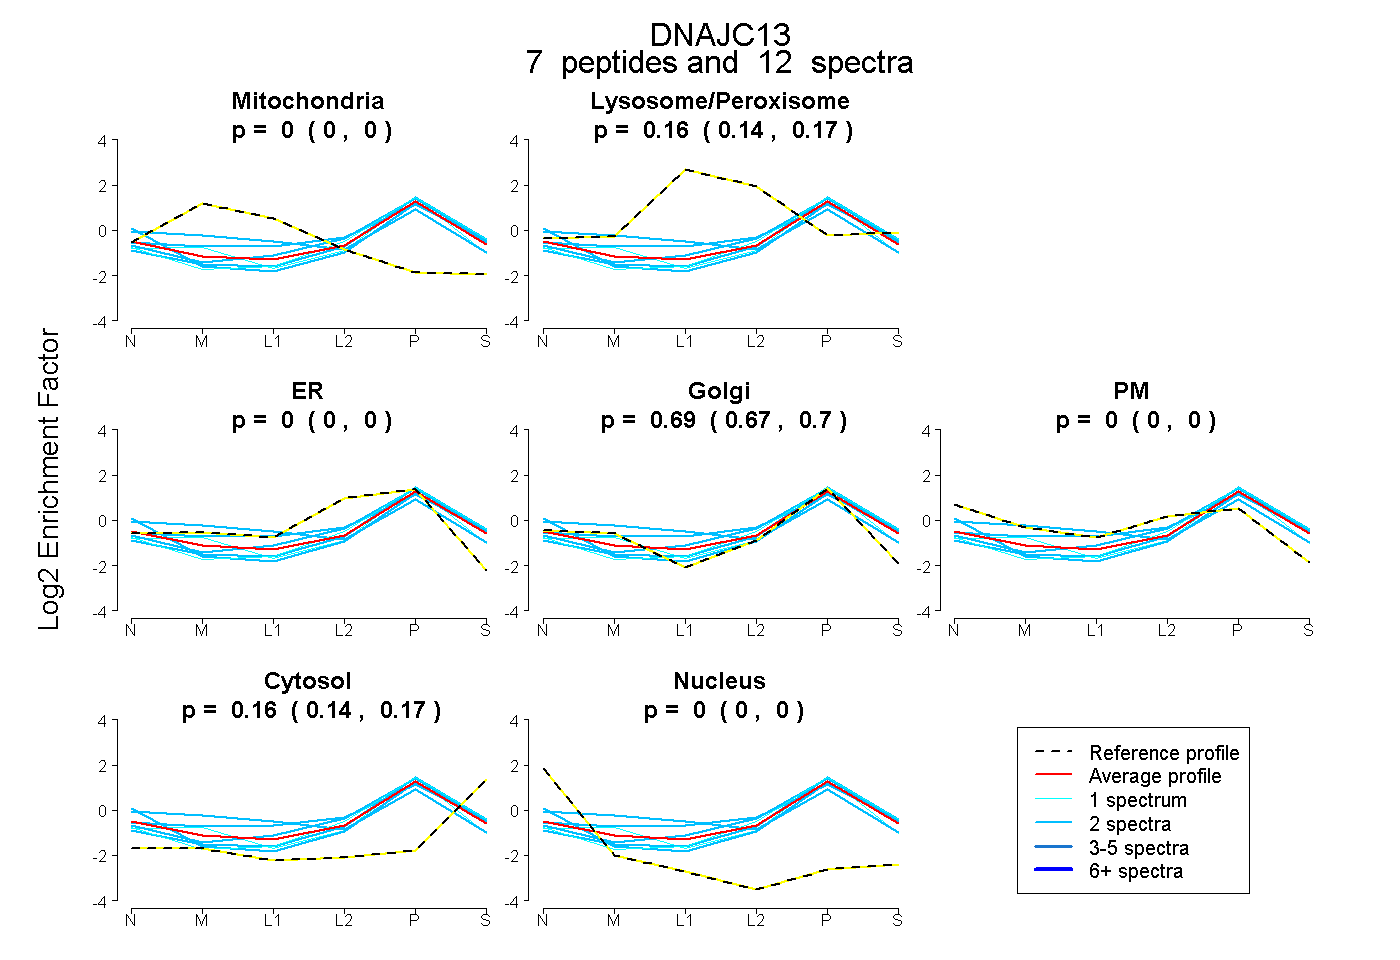
0.000 | 0.000
0.142 | 0.173
0.000 | 0.000
0.670 | 0.699
0.000 | 0.000
0.144 | 0.167
0.000 | 0.000
40peptides
spectra
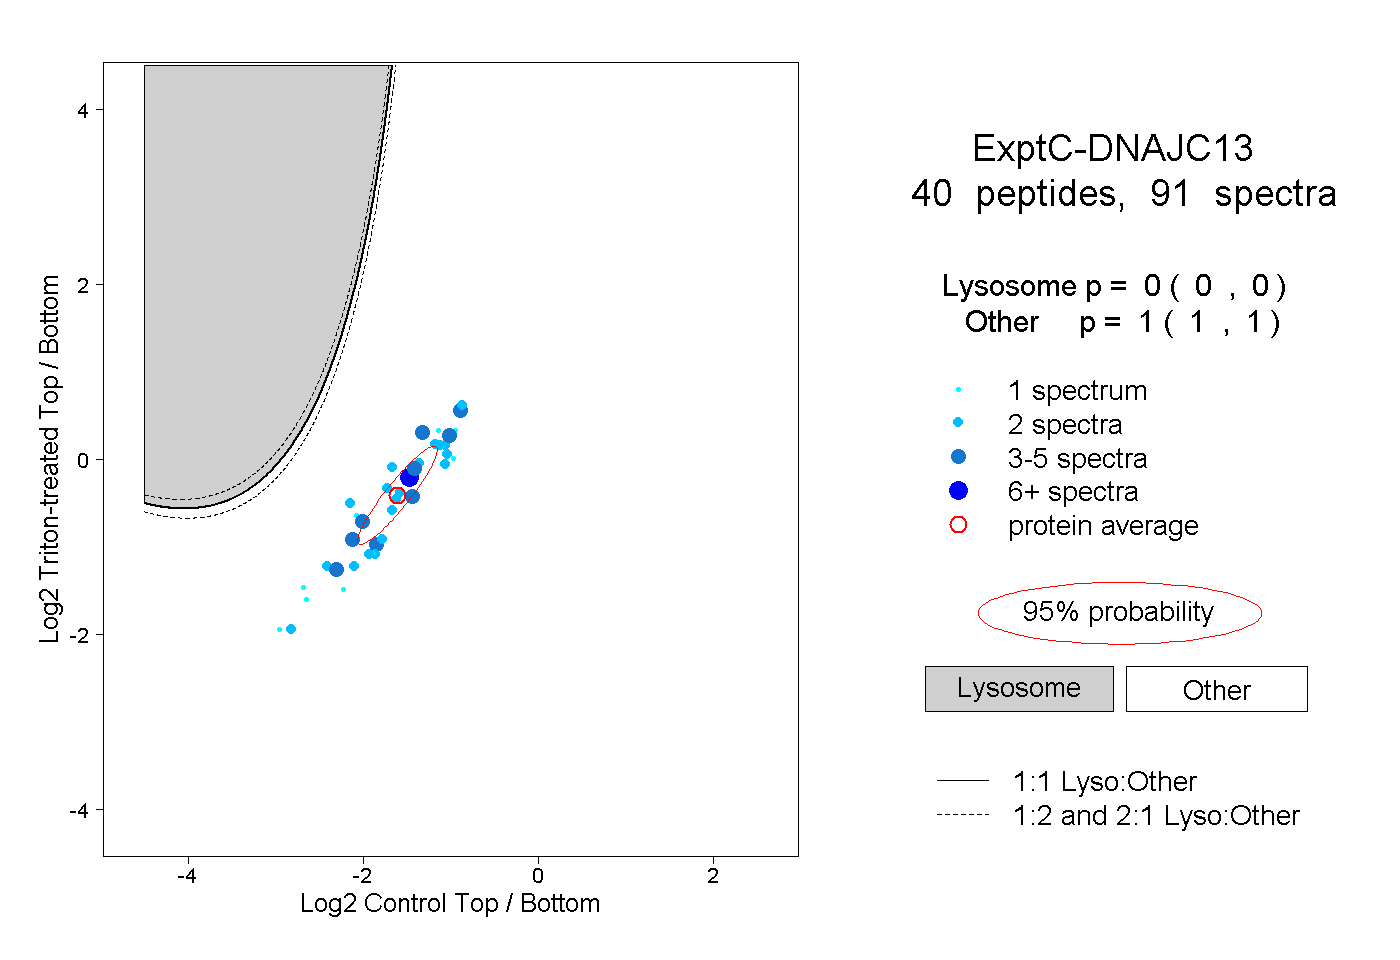
0.000 | 0.000
1.000 | 1.000
4peptides
spectra

0.000 | 0.023
0.977 | 1.000