DNAJC13
[ENSRNOP00000015344]
Main page
| | | Plot |
Mito |
Lyso |
|
Perox |
ER |
Golgi |
PM |
Cytosol |
Nucleus |
|
| Expt A |
 42
42
peptides |
94
spectra |
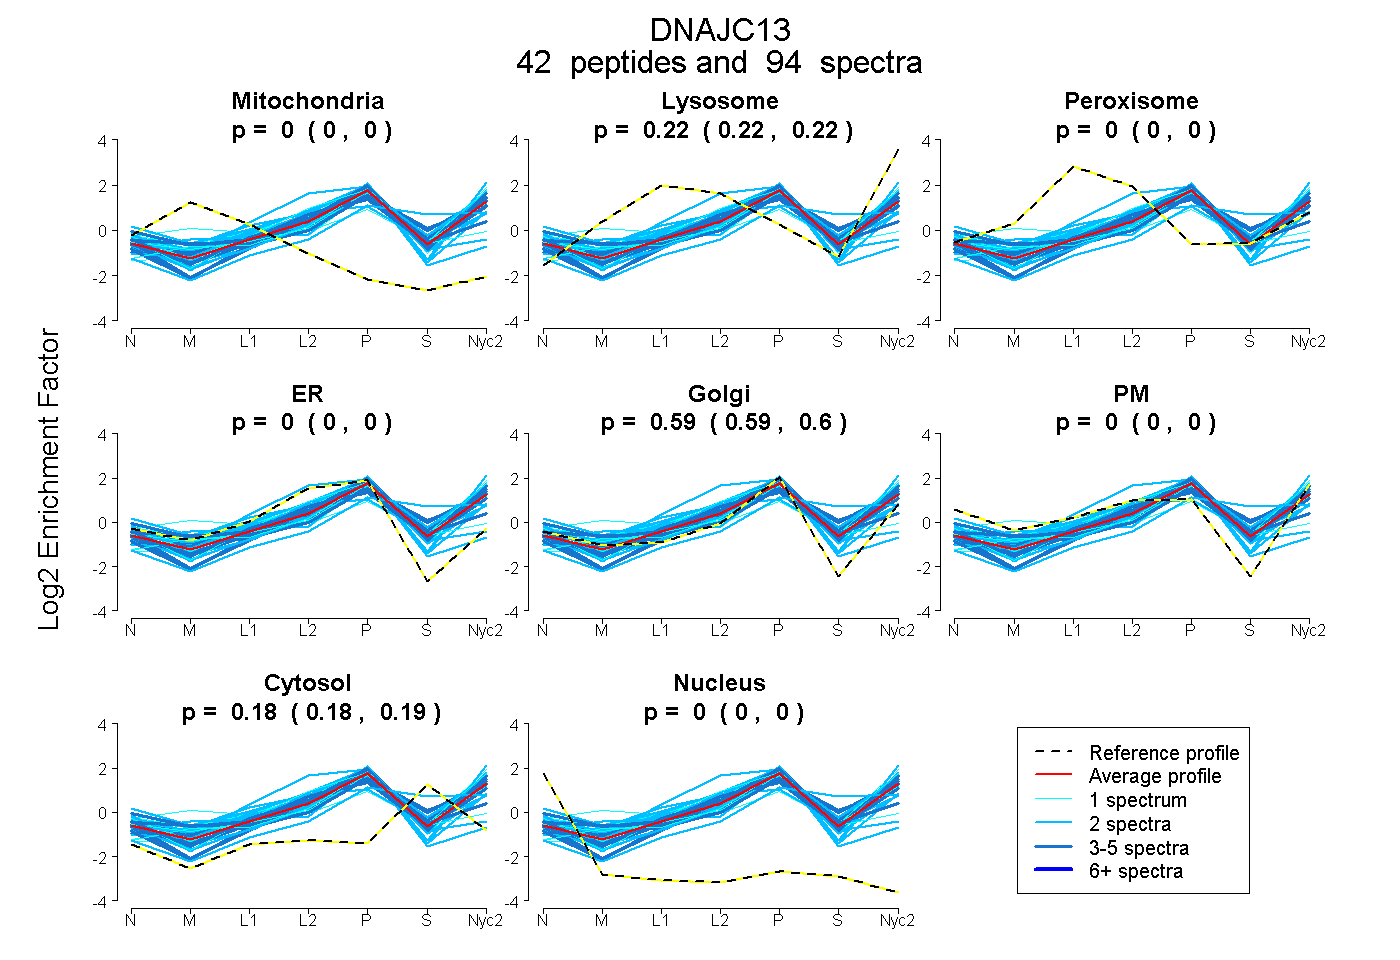 |
0.000
0.000 | 0.000 |
0.222
0.219 | 0.224 |
|
0.000
0.000 | 0.000 |
0.000
0.000 | 0.000 |
0.594
0.591 | 0.596 |
0.000
0.000 | 0.000 |
0.185
0.182 | 0.186 |
0.000
0.000 | 0.000 |
|
| | | Plot |
Mito |
|
Lyso or Perox |
|
ER |
Golgi |
PM |
Cytosol |
Nucleus |
|
| Expt B |
7
peptides |
12
spectra |
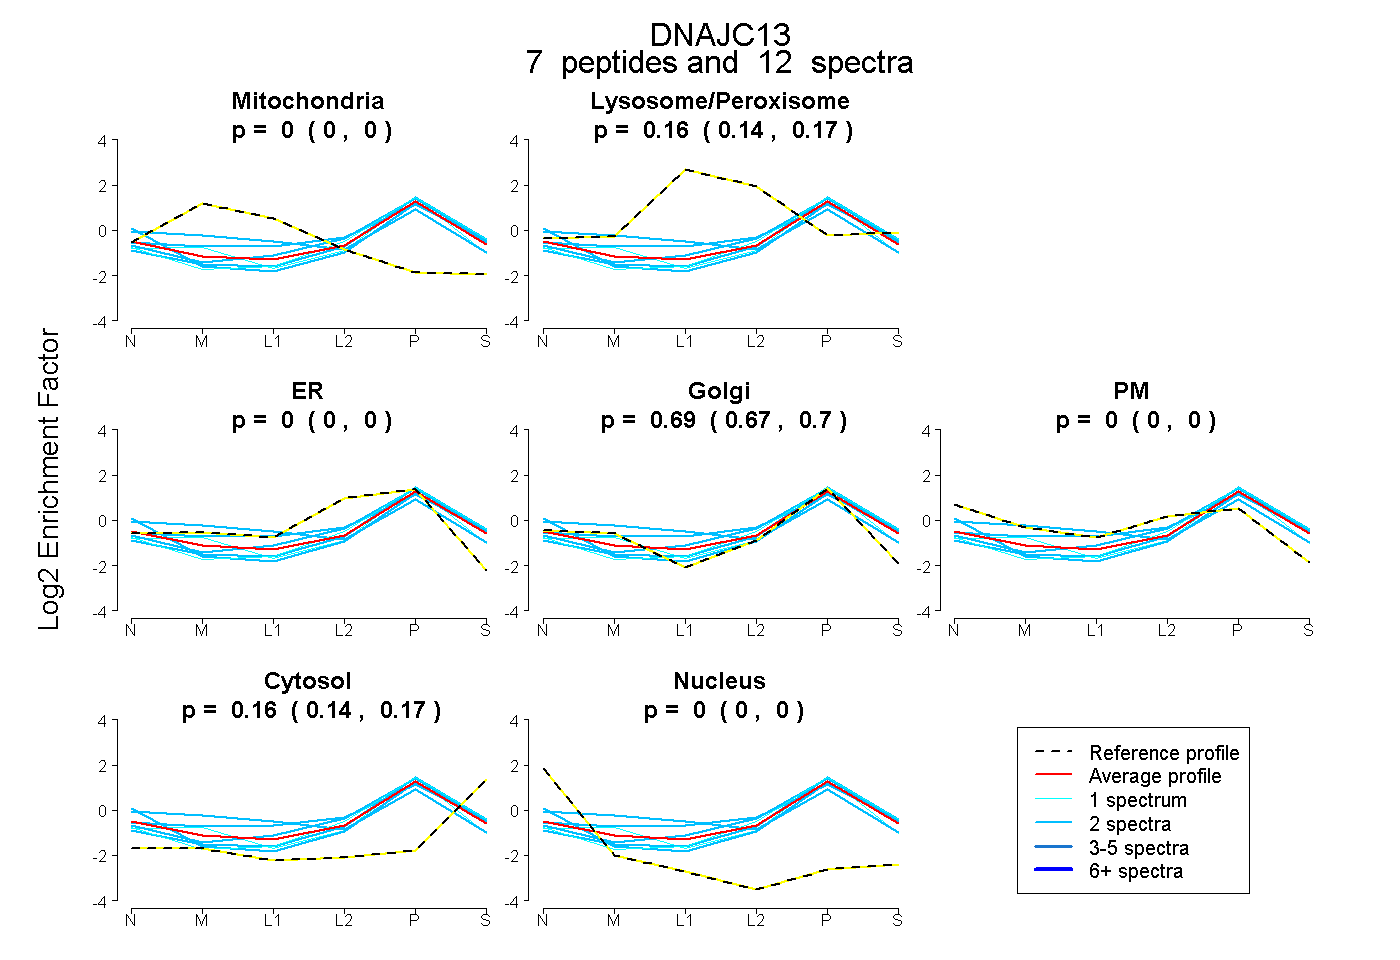 |
0.000
0.000 | 0.000 |
|
0.158
0.142 | 0.173 |
|
0.000
0.000 | 0.000 |
0.686
0.670 | 0.699 |
0.000
0.000 | 0.000 |
0.156
0.144 | 0.167 |
0.000
0.000 | 0.000 |
|
| 2 spectra, IAAHLADFTPR |
0.051 |
|
0.250 |
|
0.000 |
0.628 |
0.000 |
0.037 |
0.034 |
|
| 2 spectra, FLENLLEK |
0.000 |
|
0.179 |
|
0.063 |
0.595 |
0.000 |
0.164 |
0.000 |
|
| 1 spectrum, DQDNAIIRPLPR |
0.000 |
|
0.067 |
|
0.000 |
0.819 |
0.000 |
0.114 |
0.000 |
|
| 1 spectrum, YECLAEEIK |
0.000 |
|
0.026 |
|
0.265 |
0.452 |
0.000 |
0.257 |
0.000 |
|
| 2 spectra, EFLIALLEK |
0.000 |
|
0.073 |
|
0.074 |
0.617 |
0.000 |
0.235 |
0.000 |
|
| 2 spectra, TQSILFNR |
0.000 |
|
0.283 |
|
0.000 |
0.583 |
0.000 |
0.133 |
0.000 |
|
| 2 spectra, LTELLEK |
0.000 |
|
0.012 |
|
0.000 |
0.608 |
0.157 |
0.223 |
0.000 |
|
| | | Plot |
|
Lyso |
|
|
|
|
|
|
|
Other |
| Expt C |
40
peptides |
91
spectra |
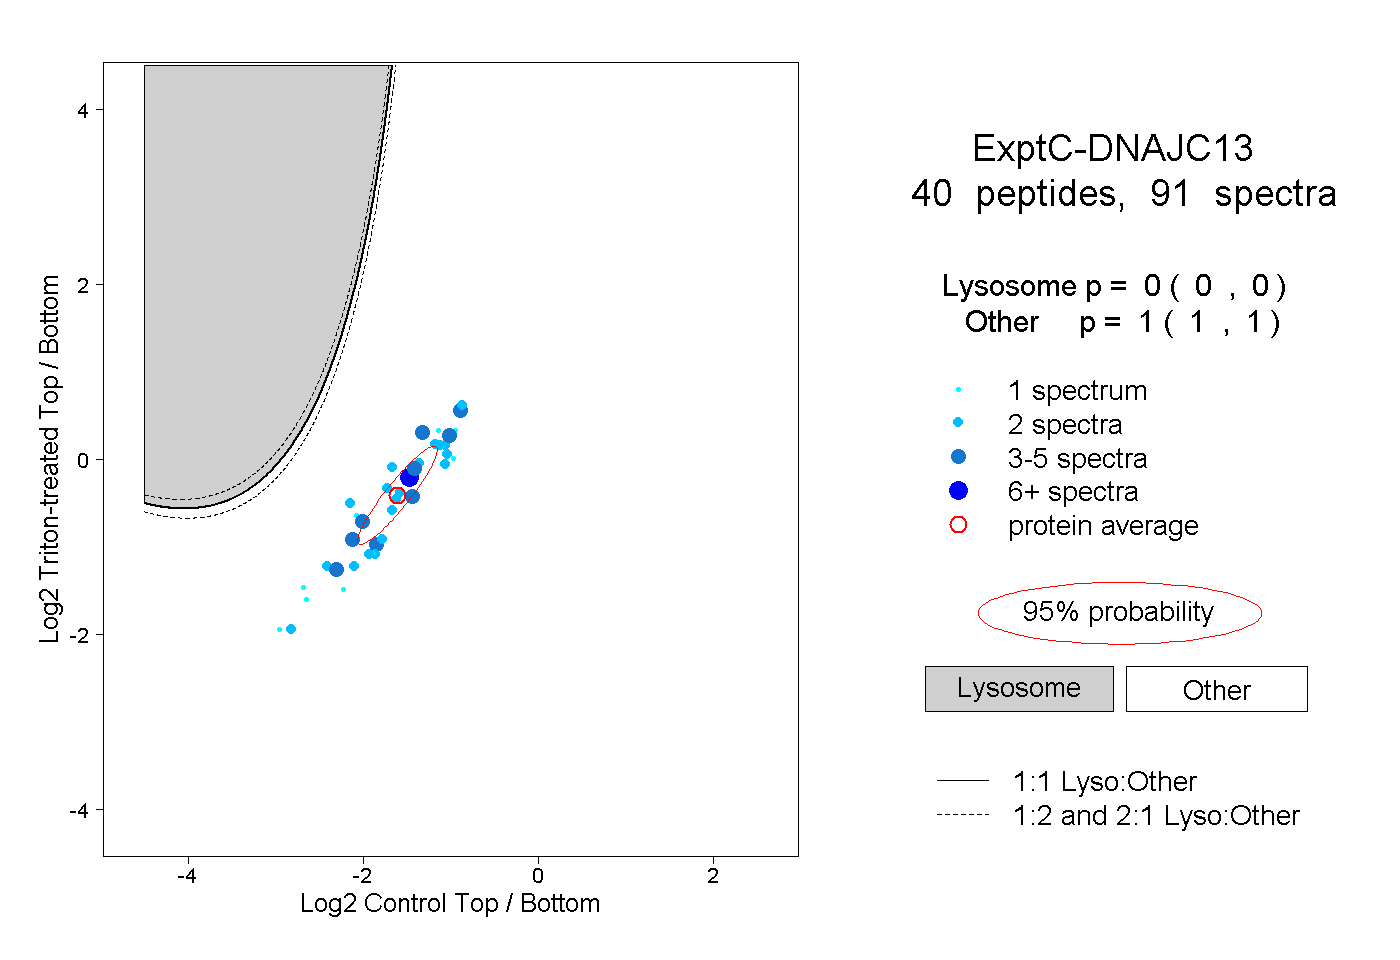 |
|
0.000
0.000 | 0.000 |
|
|
|
|
|
|
|
1.000
1.000 | 1.000 |
| | | Plot |
|
Lyso |
|
|
|
|
|
|
|
Other |
| Expt D |
4
peptides |
5
spectra |
 |
|
0.000
0.000 | 0.023 |
|
|
|
|
|
|
|
1.000
0.977 | 1.000 |