 22
22peptides
spectra
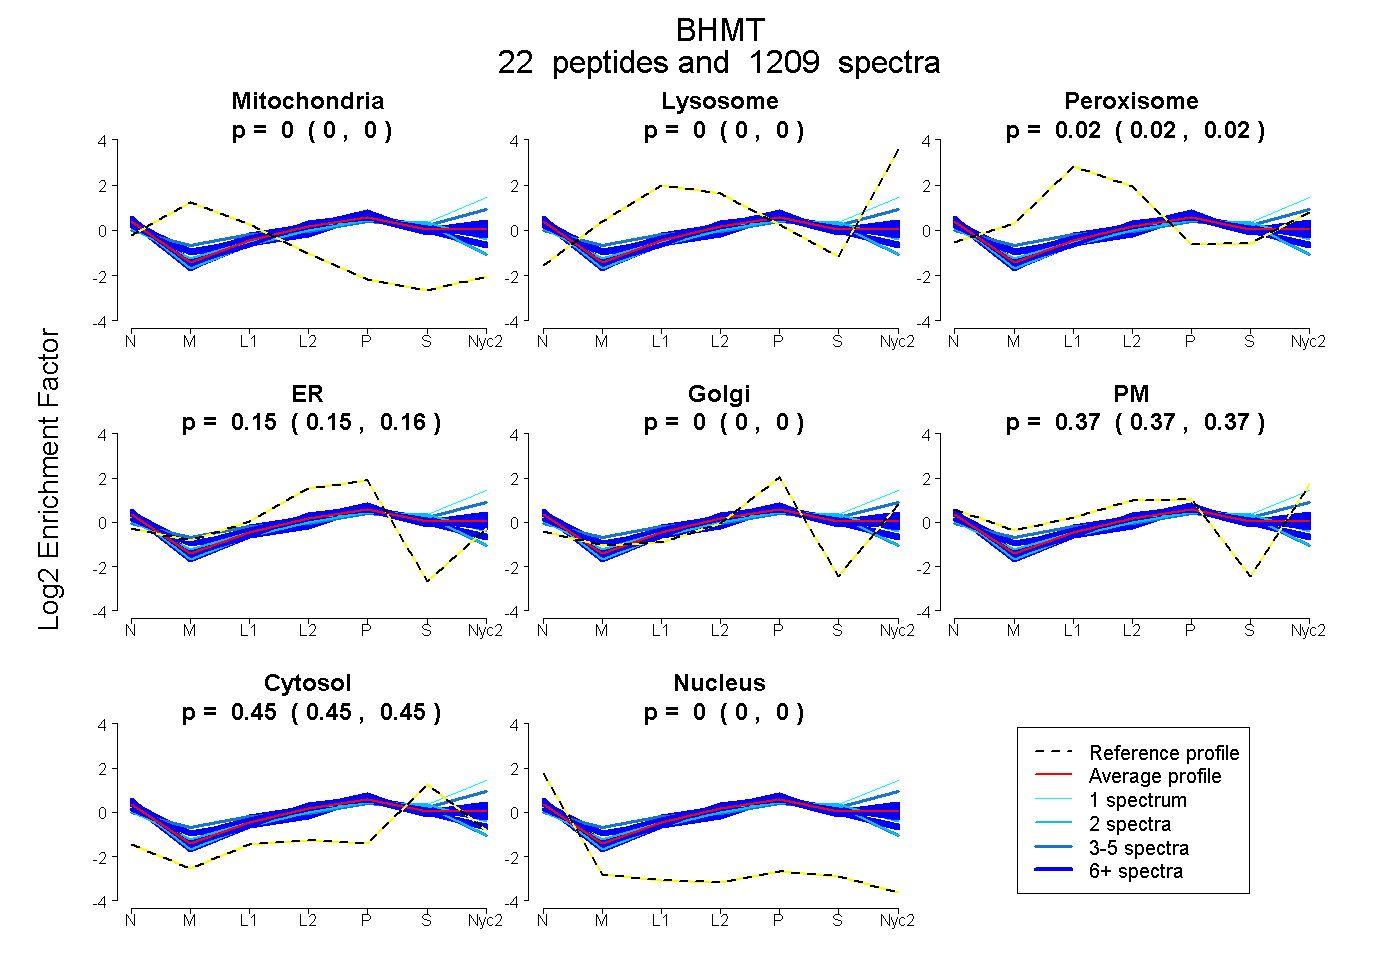
0.000 | 0.000
0.000 | 0.000
0.024 | 0.025
0.152 | 0.155
0.000 | 0.000
0.366 | 0.370
0.453 | 0.454
0.000 | 0.000
19peptides
spectra
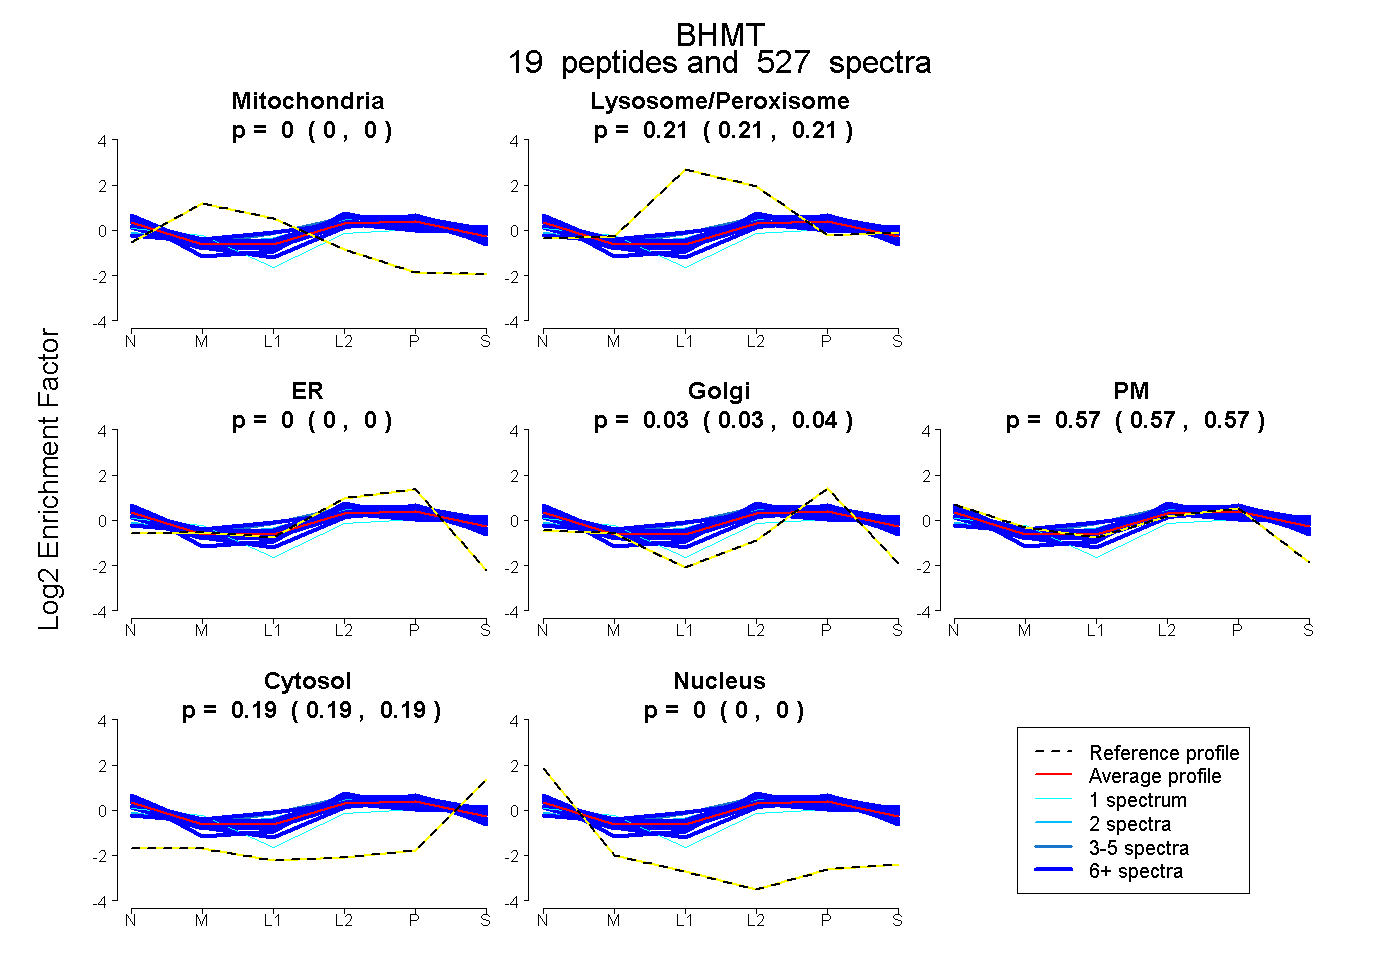
0.000 | 0.000
0.207 | 0.209
0.000 | 0.000
0.032 | 0.037
0.565 | 0.572
0.188 | 0.189
0.000 | 0.000
21peptides
spectra
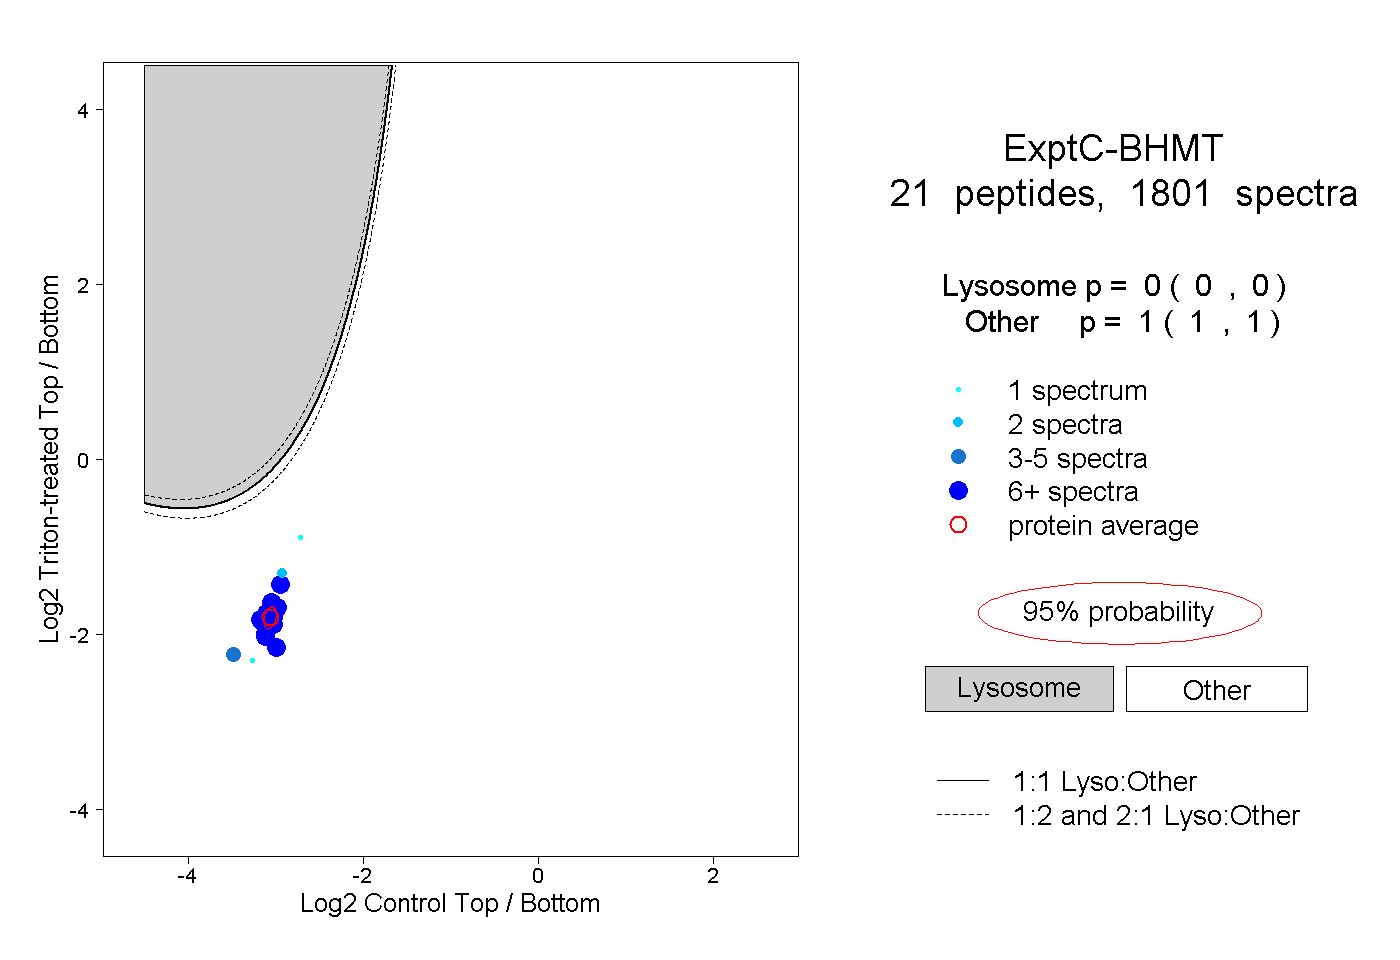
0.000 | 0.000
1.000 | 1.000
13peptides
spectra
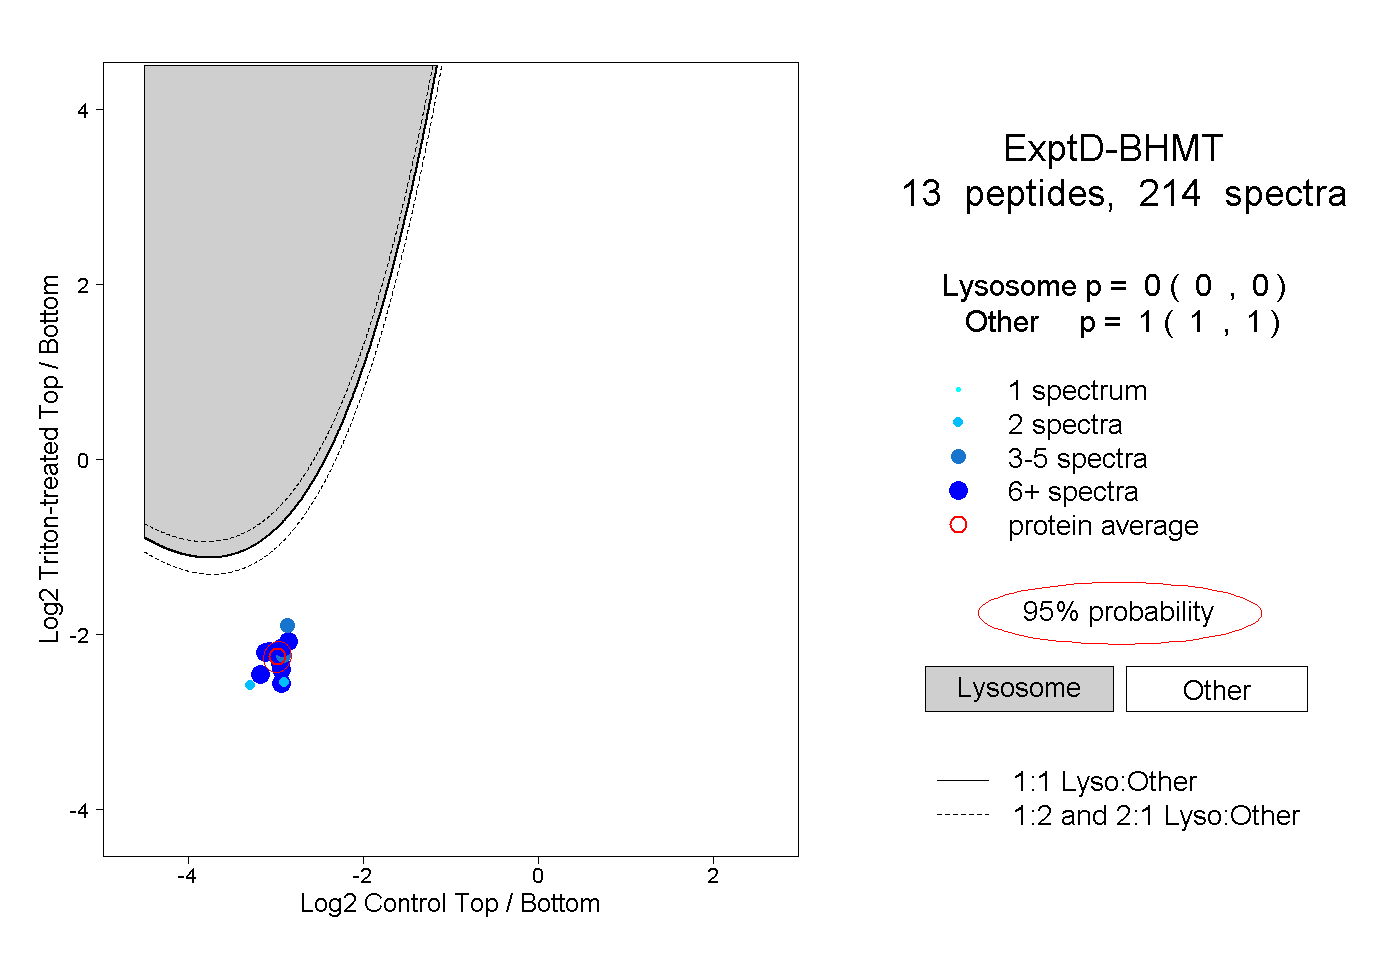
0.000 | 0.000
1.000 | 1.000