 22
22peptides
spectra
0.000 | 0.000
0.000 | 0.000
0.024 | 0.025
0.152 | 0.155
0.000 | 0.000
0.366 | 0.370
0.453 | 0.454
0.000 | 0.000
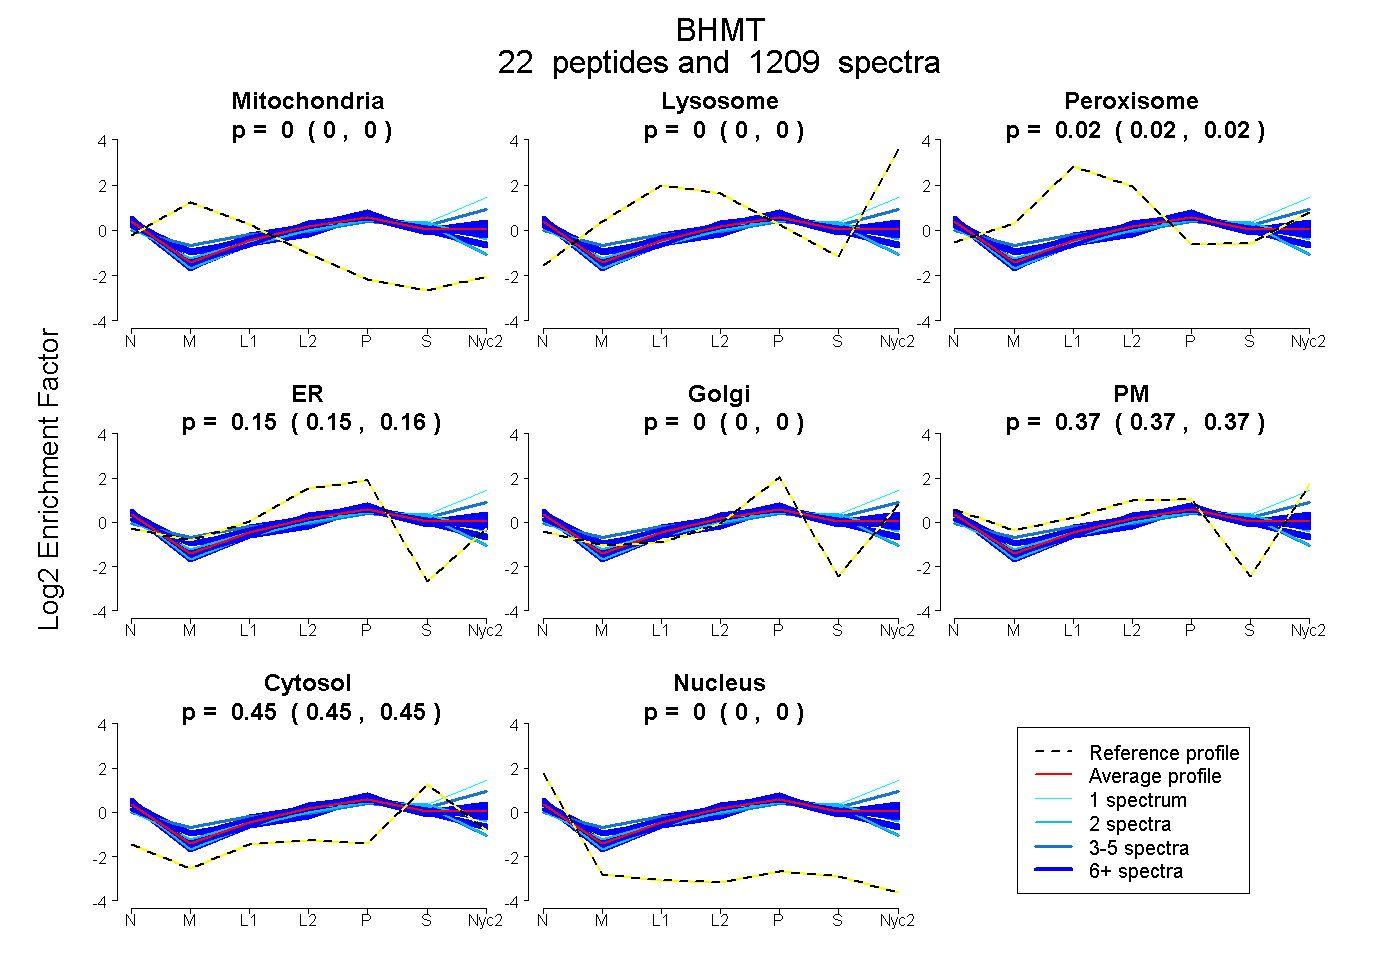
| Plot | Mito | Lyso | Perox | ER | Golgi | PM | Cytosol | Nucleus | |||||
| Expt A |
22 peptides |
1209 spectra |
|
0.000 0.000 | 0.000 |
0.000 0.000 | 0.000 |
0.024 0.024 | 0.025 |
0.154 0.152 | 0.155 |
0.000 0.000 | 0.000 |
0.368 0.366 | 0.370 |
0.454 0.453 | 0.454 |
0.000 0.000 | 0.000 |
| 52 spectra, GNYVAEK | 0.000 | 0.000 | 0.017 | 0.125 | 0.000 | 0.385 | 0.473 | 0.000 | ||
| 12 spectra, LNAGEVVIGDGGFVFALEK | 0.000 | 0.000 | 0.012 | 0.136 | 0.000 | 0.369 | 0.484 | 0.000 | ||
| 59 spectra, GFLPPASEK | 0.000 | 0.000 | 0.021 | 0.085 | 0.000 | 0.445 | 0.450 | 0.000 | ||
| 27 spectra, AYLMSQPLAYHTPDCGK | 0.000 | 0.000 | 0.010 | 0.181 | 0.000 | 0.359 | 0.449 | 0.000 | ||
| 164 spectra, EGLEAAR | 0.000 | 0.000 | 0.024 | 0.077 | 0.000 | 0.456 | 0.442 | 0.000 | ||
| 34 spectra, APLAGK | 0.000 | 0.000 | 0.038 | 0.138 | 0.000 | 0.431 | 0.394 | 0.000 | ||
| 5 spectra, AGAAIVGVNCHFDPSTSLQTIK | 0.000 | 0.000 | 0.112 | 0.373 | 0.000 | 0.000 | 0.466 | 0.049 | ||
| 2 spectra, QVADEGDALVAGGVSQTPSYLSCK | 0.000 | 0.000 | 0.056 | 0.389 | 0.000 | 0.000 | 0.496 | 0.059 | ||
| 63 spectra, AGPWTPEAAVEHPEAVR | 0.000 | 0.000 | 0.067 | 0.113 | 0.000 | 0.394 | 0.426 | 0.000 | ||
| 15 spectra, QGFIDLPEFPFGLEPR | 0.000 | 0.000 | 0.000 | 0.085 | 0.000 | 0.482 | 0.433 | 0.000 | ||
| 100 spectra, VNEAACDIAR | 0.000 | 0.000 | 0.000 | 0.242 | 0.000 | 0.310 | 0.447 | 0.000 | ||
| 2 spectra, TSGKPIAATMCIGPEGDLHGVSPGECAVR | 0.000 | 0.000 | 0.100 | 0.270 | 0.000 | 0.133 | 0.497 | 0.000 | ||
| 138 spectra, EATTEQQLR | 0.000 | 0.000 | 0.000 | 0.319 | 0.000 | 0.161 | 0.457 | 0.062 | ||
| 49 spectra, IFHQQLEVFMK | 0.000 | 0.000 | 0.036 | 0.023 | 0.000 | 0.500 | 0.441 | 0.000 | ||
| 61 spectra, YIGGCCGFEPYHIR | 0.000 | 0.000 | 0.119 | 0.246 | 0.000 | 0.196 | 0.439 | 0.000 | ||
| 95 spectra, EAYNLGVR | 0.000 | 0.000 | 0.061 | 0.129 | 0.000 | 0.401 | 0.409 | 0.000 | ||
| 15 spectra, SETEVK | 0.000 | 0.000 | 0.009 | 0.075 | 0.000 | 0.486 | 0.429 | 0.000 | ||
| 189 spectra, AIAEELAPER | 0.000 | 0.000 | 0.000 | 0.078 | 0.000 | 0.467 | 0.455 | 0.000 | ||
| 3 spectra, HGSWGSGLDMHTKPWIR | 0.000 | 0.107 | 0.063 | 0.000 | 0.000 | 0.412 | 0.418 | 0.000 | ||
| 61 spectra, EYWQNLR | 0.000 | 0.000 | 0.022 | 0.136 | 0.000 | 0.420 | 0.422 | 0.000 | ||
| 1 spectrum, AGSNVMQTFTFYASEDK | 0.000 | 0.135 | 0.000 | 0.000 | 0.000 | 0.429 | 0.436 | 0.000 | ||
| 62 spectra, GAAELMQQK | 0.000 | 0.000 | 0.000 | 0.313 | 0.000 | 0.179 | 0.472 | 0.036 |
| Plot | Mito | Lyso or Perox | ER | Golgi | PM | Cytosol | Nucleus | ||||||
| Expt B |
19 peptides |
527 spectra |
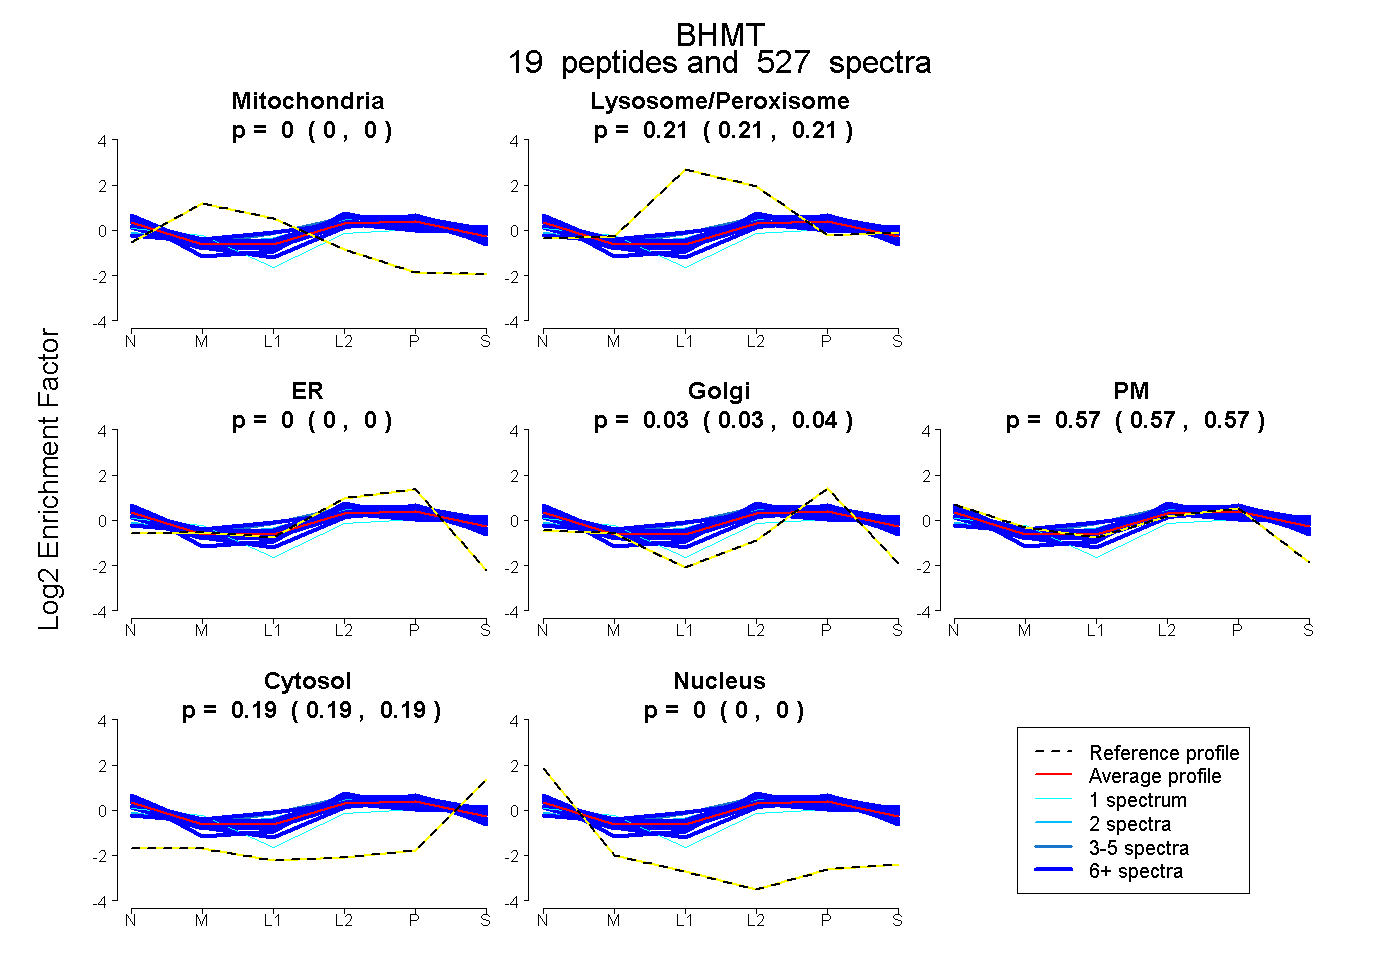 |
0.000 0.000 | 0.000 |
0.208 0.207 | 0.209 |
0.000 0.000 | 0.000 |
0.035 0.032 | 0.037 |
0.569 0.565 | 0.572 |
0.189 0.188 | 0.189 |
0.000 0.000 | 0.000 |
|||
| Plot | Lyso | Other | |||||||||||
| Expt C |
21 peptides |
1801 spectra |
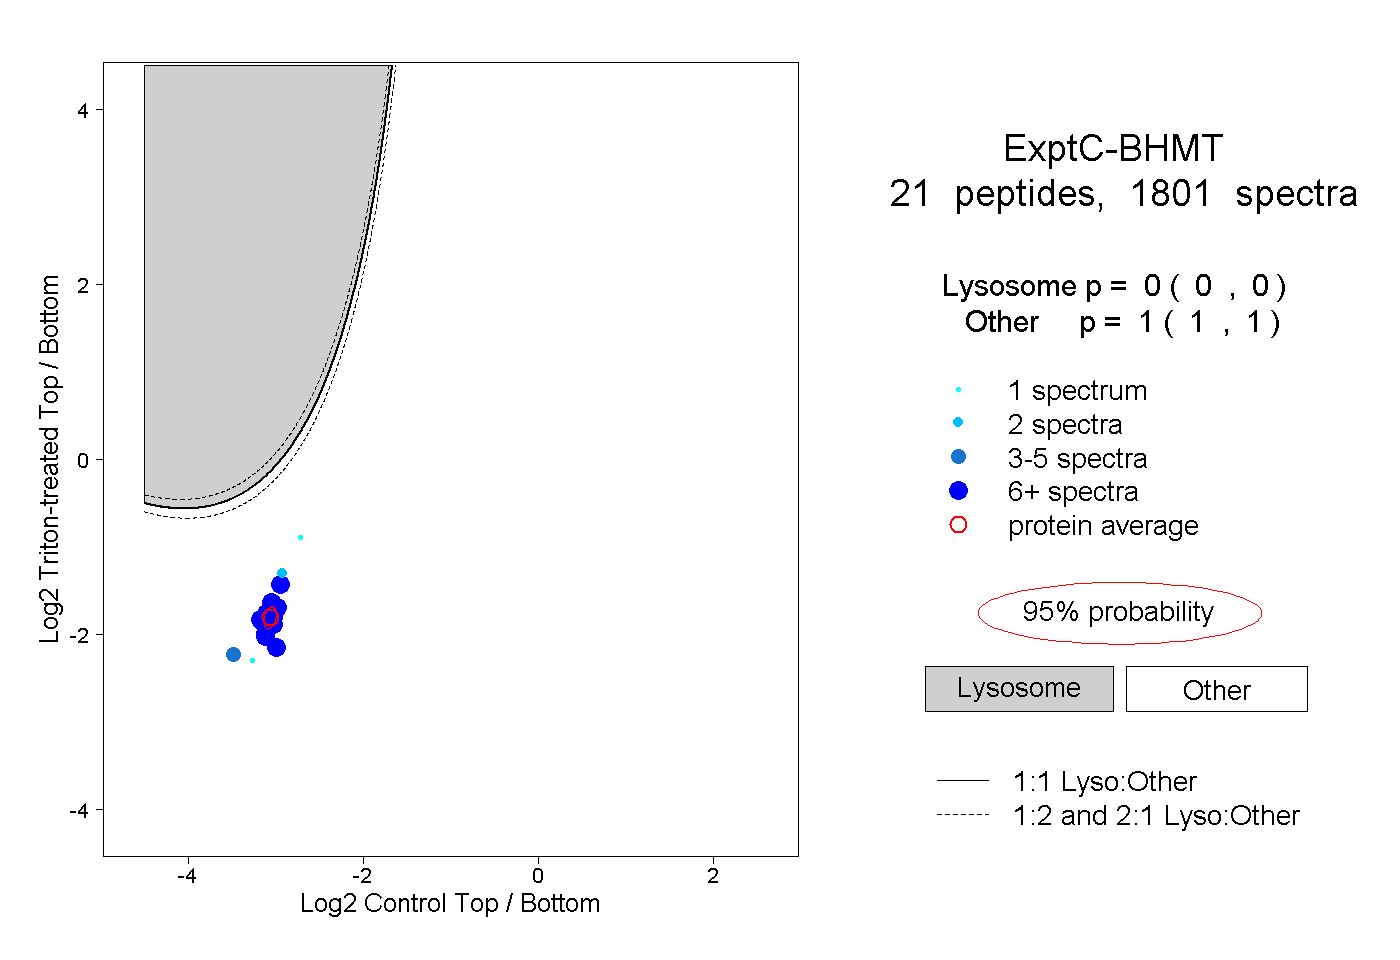 |
0.000 0.000 | 0.000 |
1.000 1.000 | 1.000 |
||||||||
| Plot | Lyso | Other | |||||||||||
| Expt D |
13 peptides |
214 spectra |
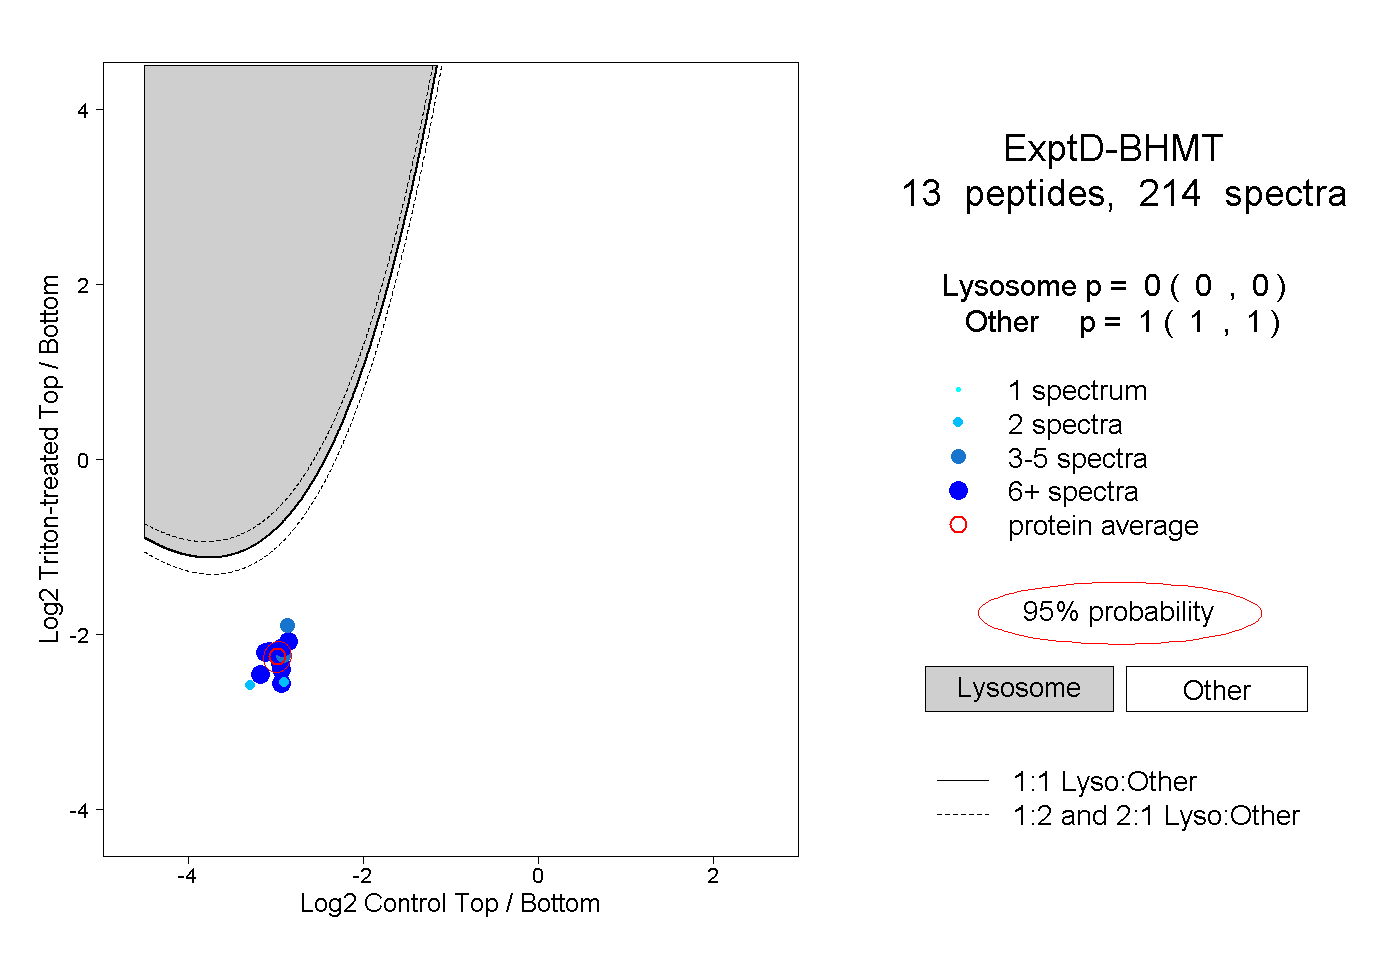 |
0.000 0.000 | 0.000 |
1.000 1.000 | 1.000 |