 28
28peptides
spectra
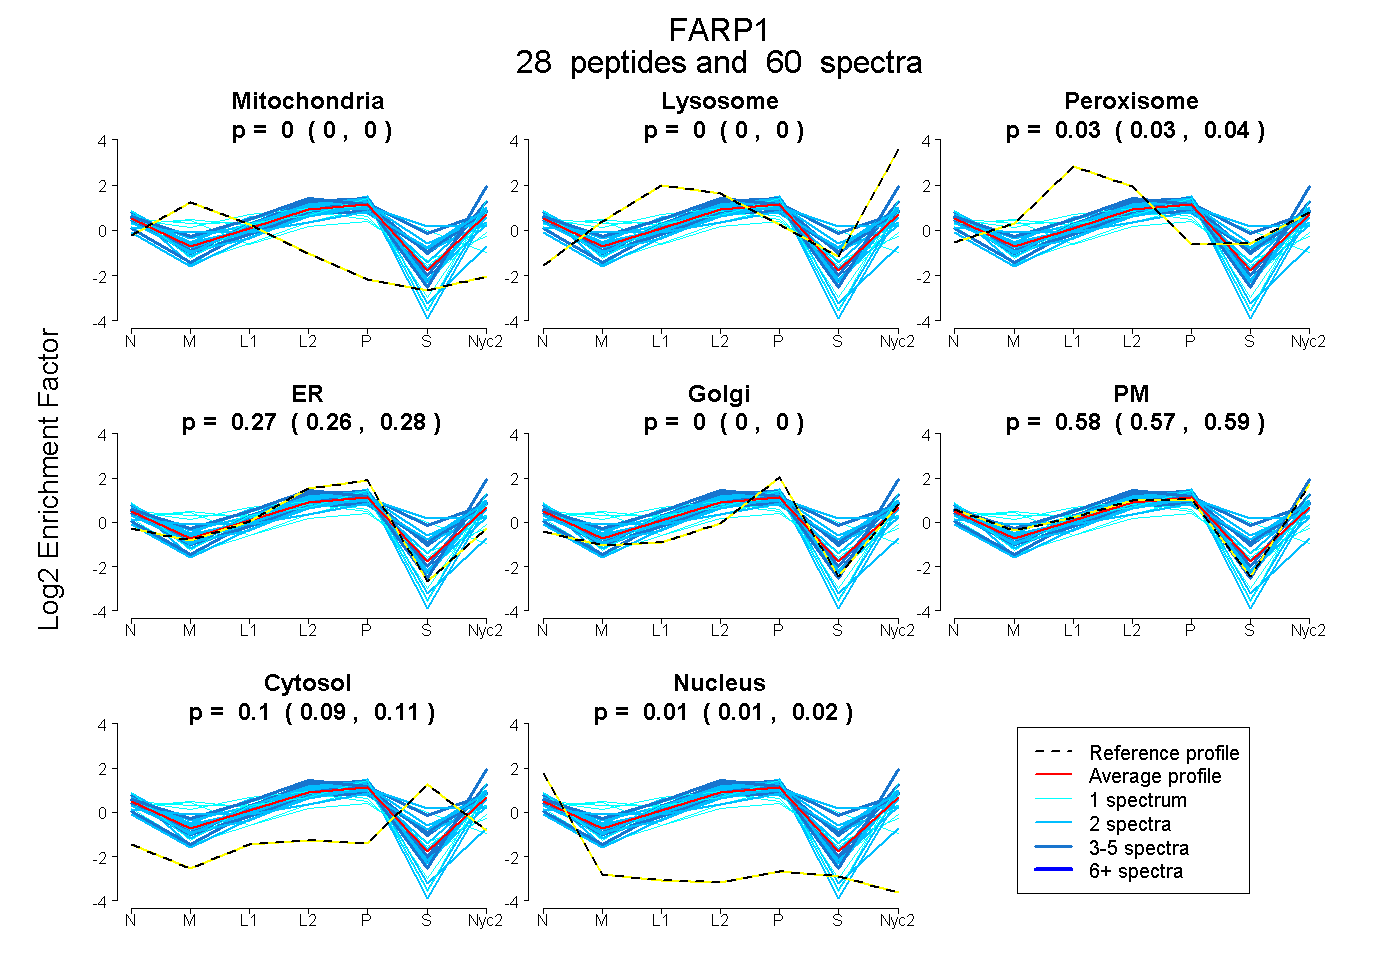
0.000 | 0.000
0.000 | 0.000
0.027 | 0.037
0.264 | 0.280
0.000 | 0.000
0.568 | 0.590
0.093 | 0.110
0.008 | 0.017
7peptides
spectra
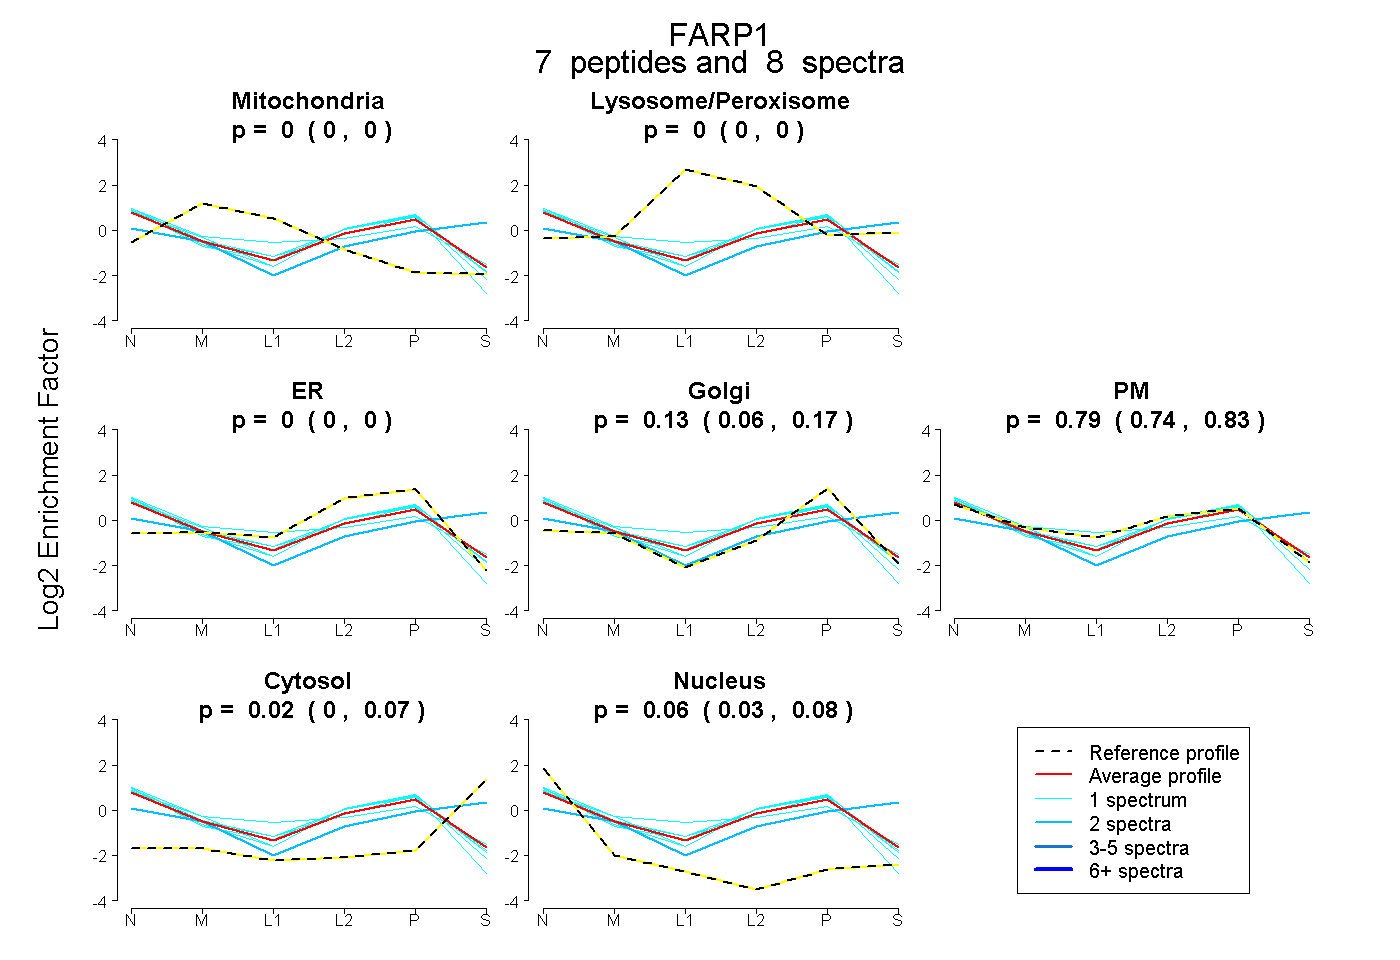
0.000 | 0.000
0.000 | 0.000
0.000 | 0.000
0.064 | 0.171
0.741 | 0.828
0.000 | 0.067
0.031 | 0.082
23peptides
spectra
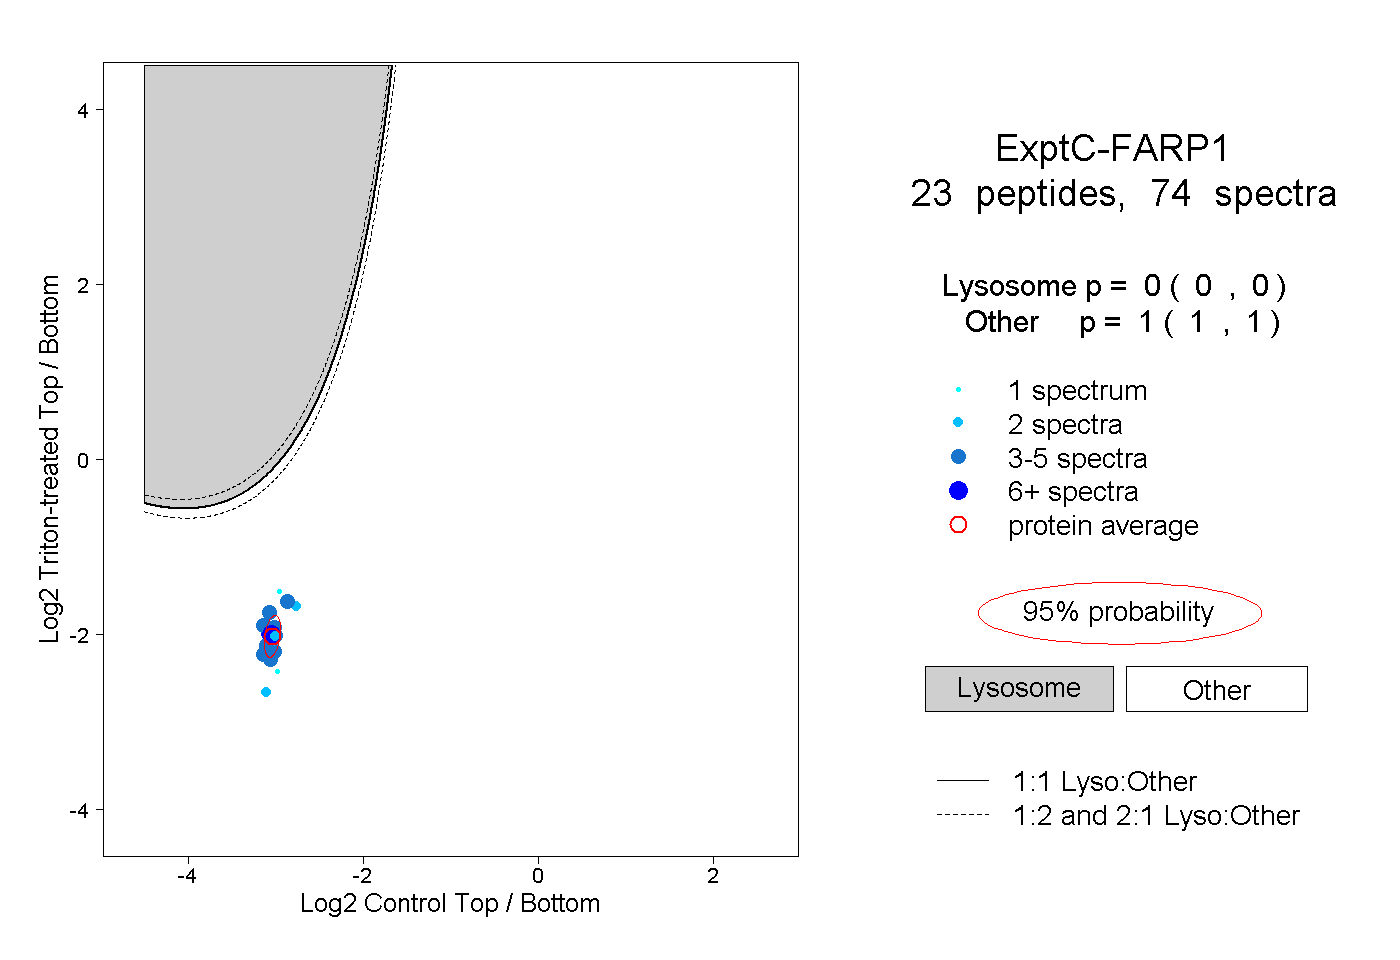
0.000 | 0.000
1.000 | 1.000
2peptides
spectra
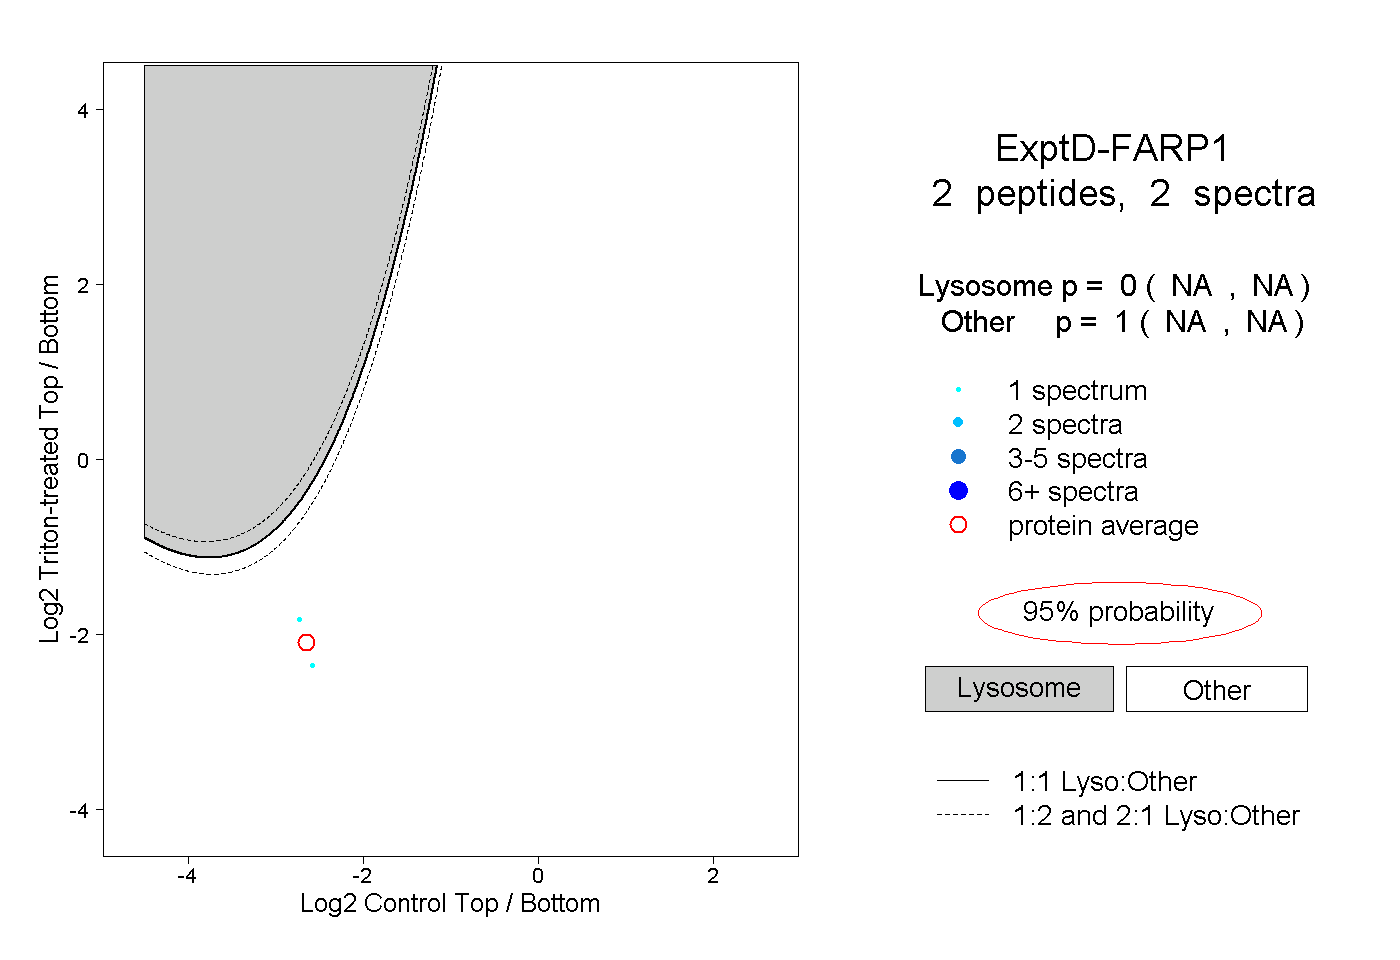
NA | NA
NA | NA